A fleet average describes nobody.
Pick the boats that matter, and the numbers change.
Planned as a product. This event-cohort analysis is the basis of the Event Pack — the packaged, public-results-only results-intelligence pack for organizers and media. See Event Pack →
The fleet is too big to reason about.
A number computed across an entire fleet is true and useless. It mixes classes that never race each other, hulls separated by decades of design, and boats that have never met on a start line. Nobody in it recognizes themselves.
The fix is not a better average. It is a smaller, deliberately chosen group — and then the same analysis, run against that group alone.
Filter to an event.
Start from a regatta that actually happened. The cohort is now the boats that raced it — not a category, not a rating band, but a real entry list with results behind it.
The panel keeps score as you narrow, so the scope of every number downstream is never in doubt.
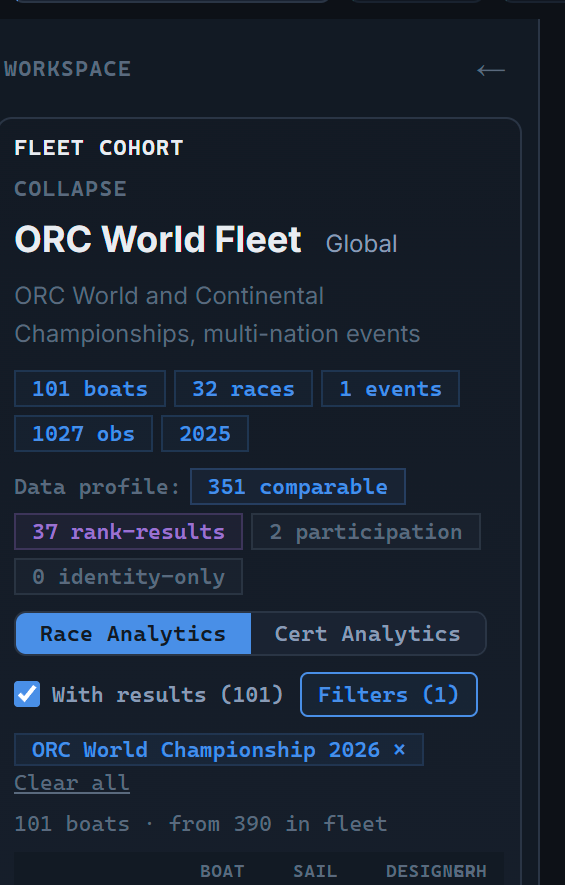
Narrow to a class.
Within the event, take the scoring class you care about. Now every boat in the cohort raced the same races under the same rules against each other — which is what makes a comparison worth making.
Select the class and its members come with it, each carrying its own certificate measurements, rating and race record.
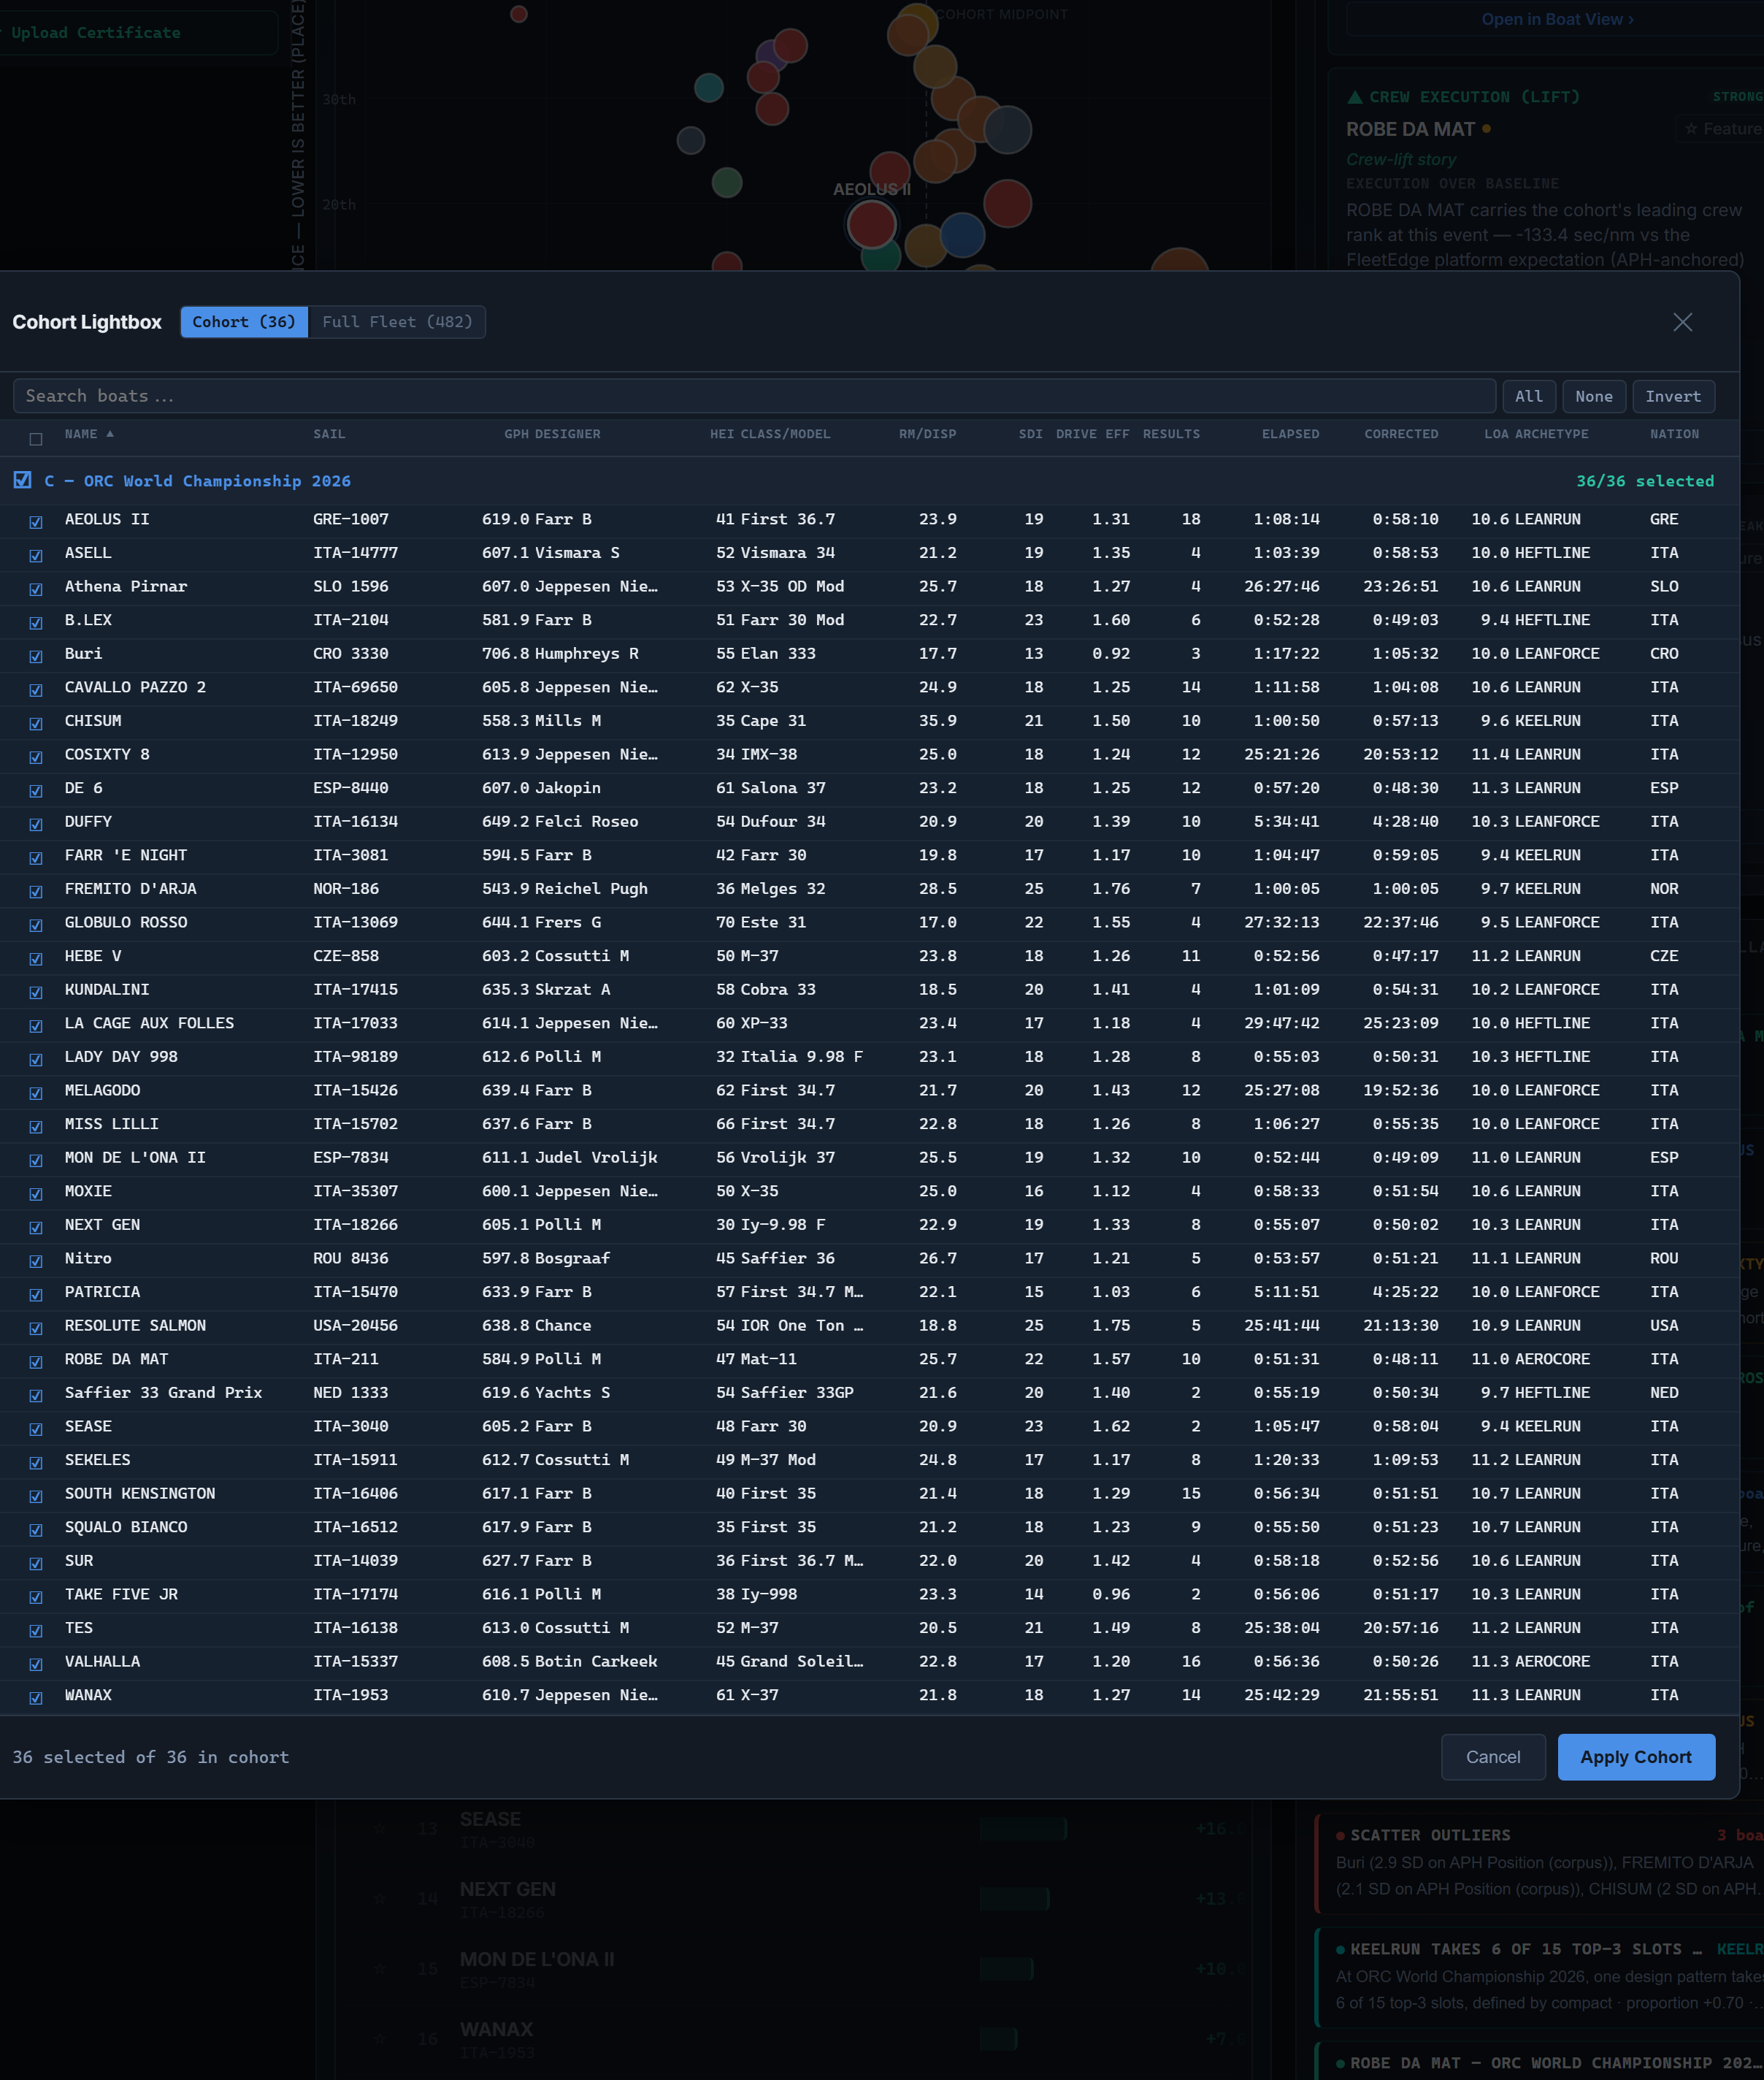
Every dimension recomputes to your selection.
This is the part that matters. Percentile rank is recalculated within the active cohort — so a boat that reads mid-pack against the world can read top of its class, and both statements are correct because they answer different questions.
Scatter plots, rankings, archetype distribution and the condition analysis all follow the same selection. Change the boats and you change the answer, which is precisely why you choose them.

That is a cohort study.
What you have just built — a named group of boats, read across the dimensions that separate them — is the same thing a published cohort study does, with the discipline turned up.
Cohort Studies
What one looks like taken to publication standard: rank the class on the dimension you care about, and see where it sits on stability (how much righting moment the boat carries relative to its displacement) and VMG balance.
Expert Cohort Studies
How far the method goes: what a composite index is made of, which population every figure is computed against, and where the analysis says it does not know.
What a recomputed cohort can and cannot say. Percentiles recomputed over the cohort you selected are an analytics reading of that selection — the world view and the class view can both be true, because they answer different questions. The reading certifies no rating and settles no result.
FleetEdge alters no rating and no score — ORC remains the rating and scoring authority.
Your fleet. Your race. Your competition.
Build the cohort that answers your question, then read it across every dimension.