Better sails, hull work, or better crew?
Pick the boats that matter. Rank them on the dimension you care about. Read the answer.
One event, one class, six ways to read them.
A whole-fleet average describes nobody. A cohort study starts by naming the boats in scope — here, one class at one world championship — and every number on the page is computed against that group and no other.
Six analytical families sit across the top. One is primary at a time, and the same boats re-read themselves under each.

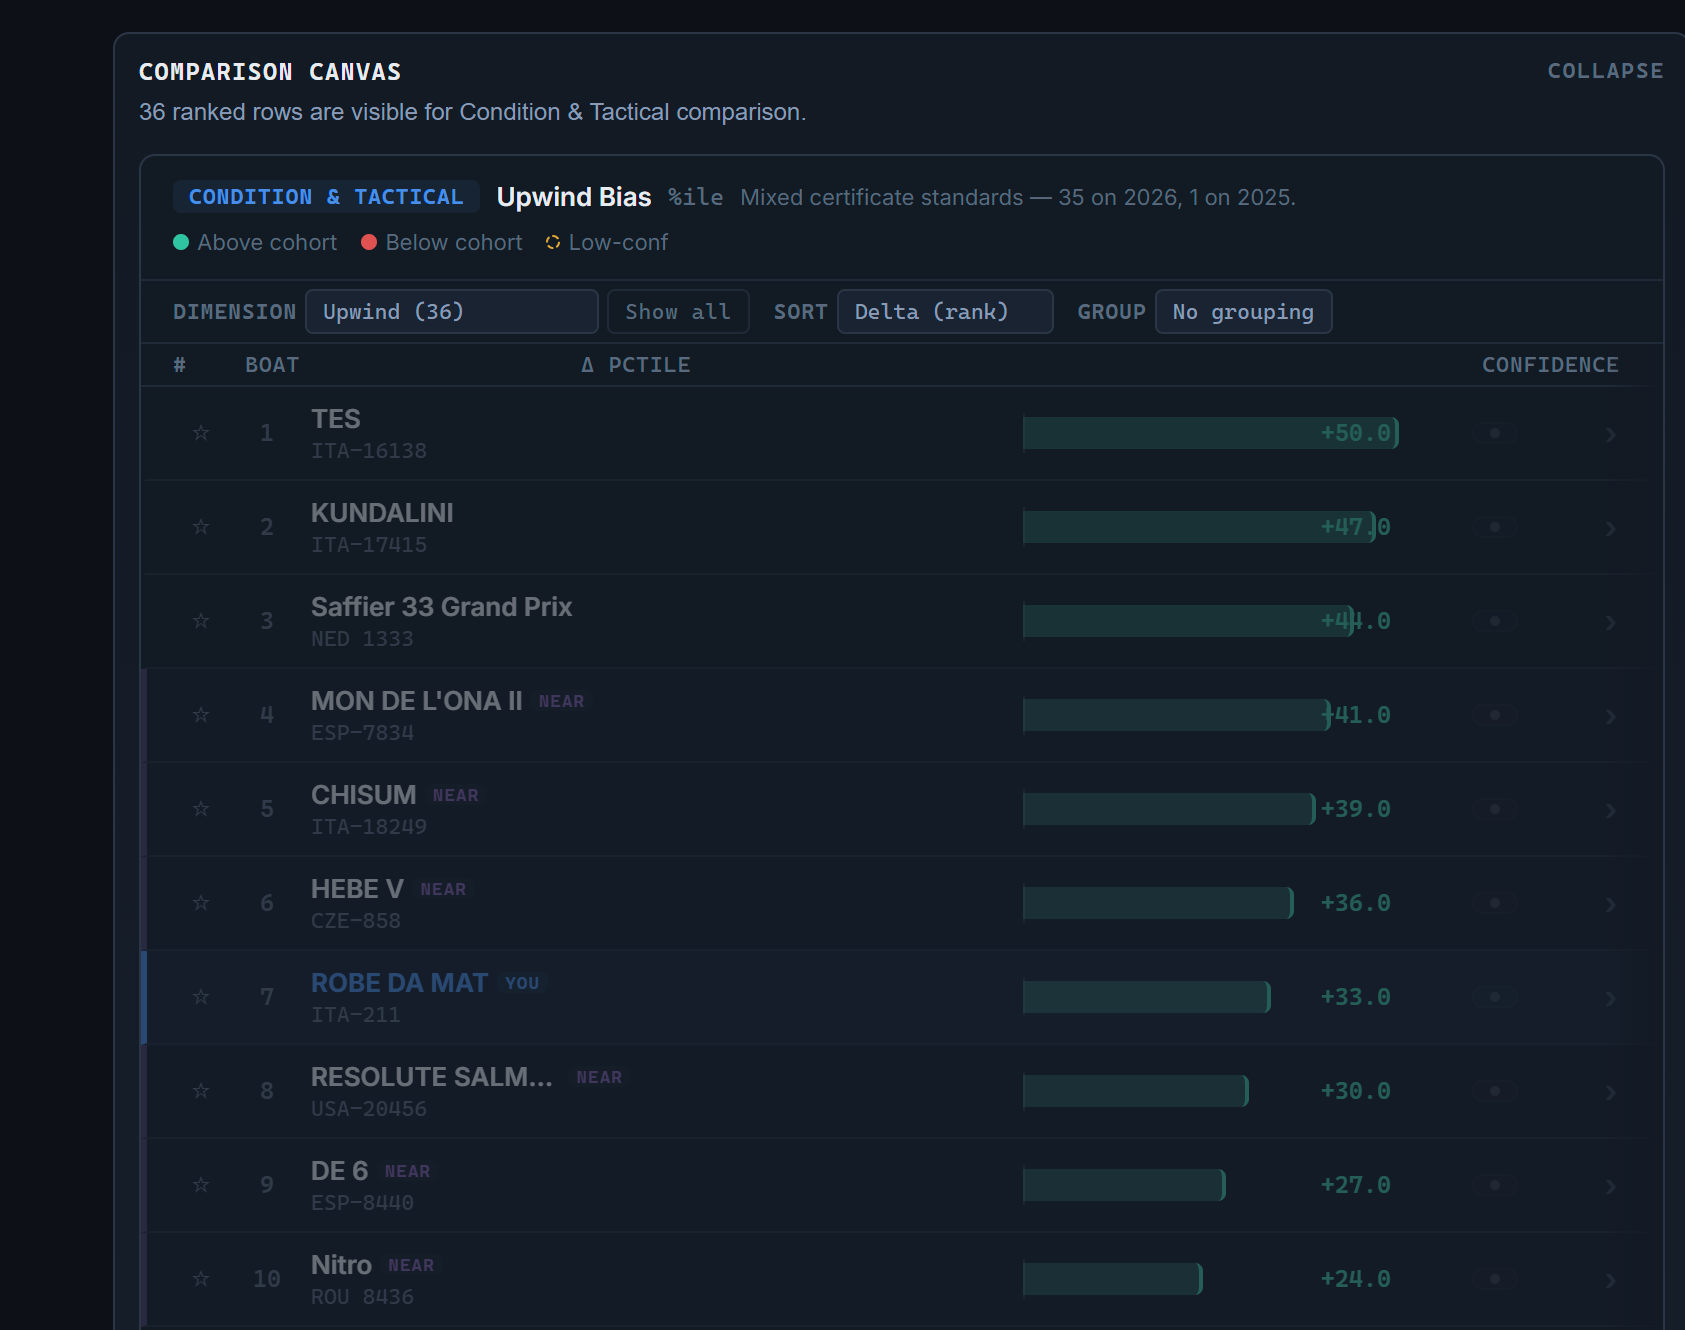
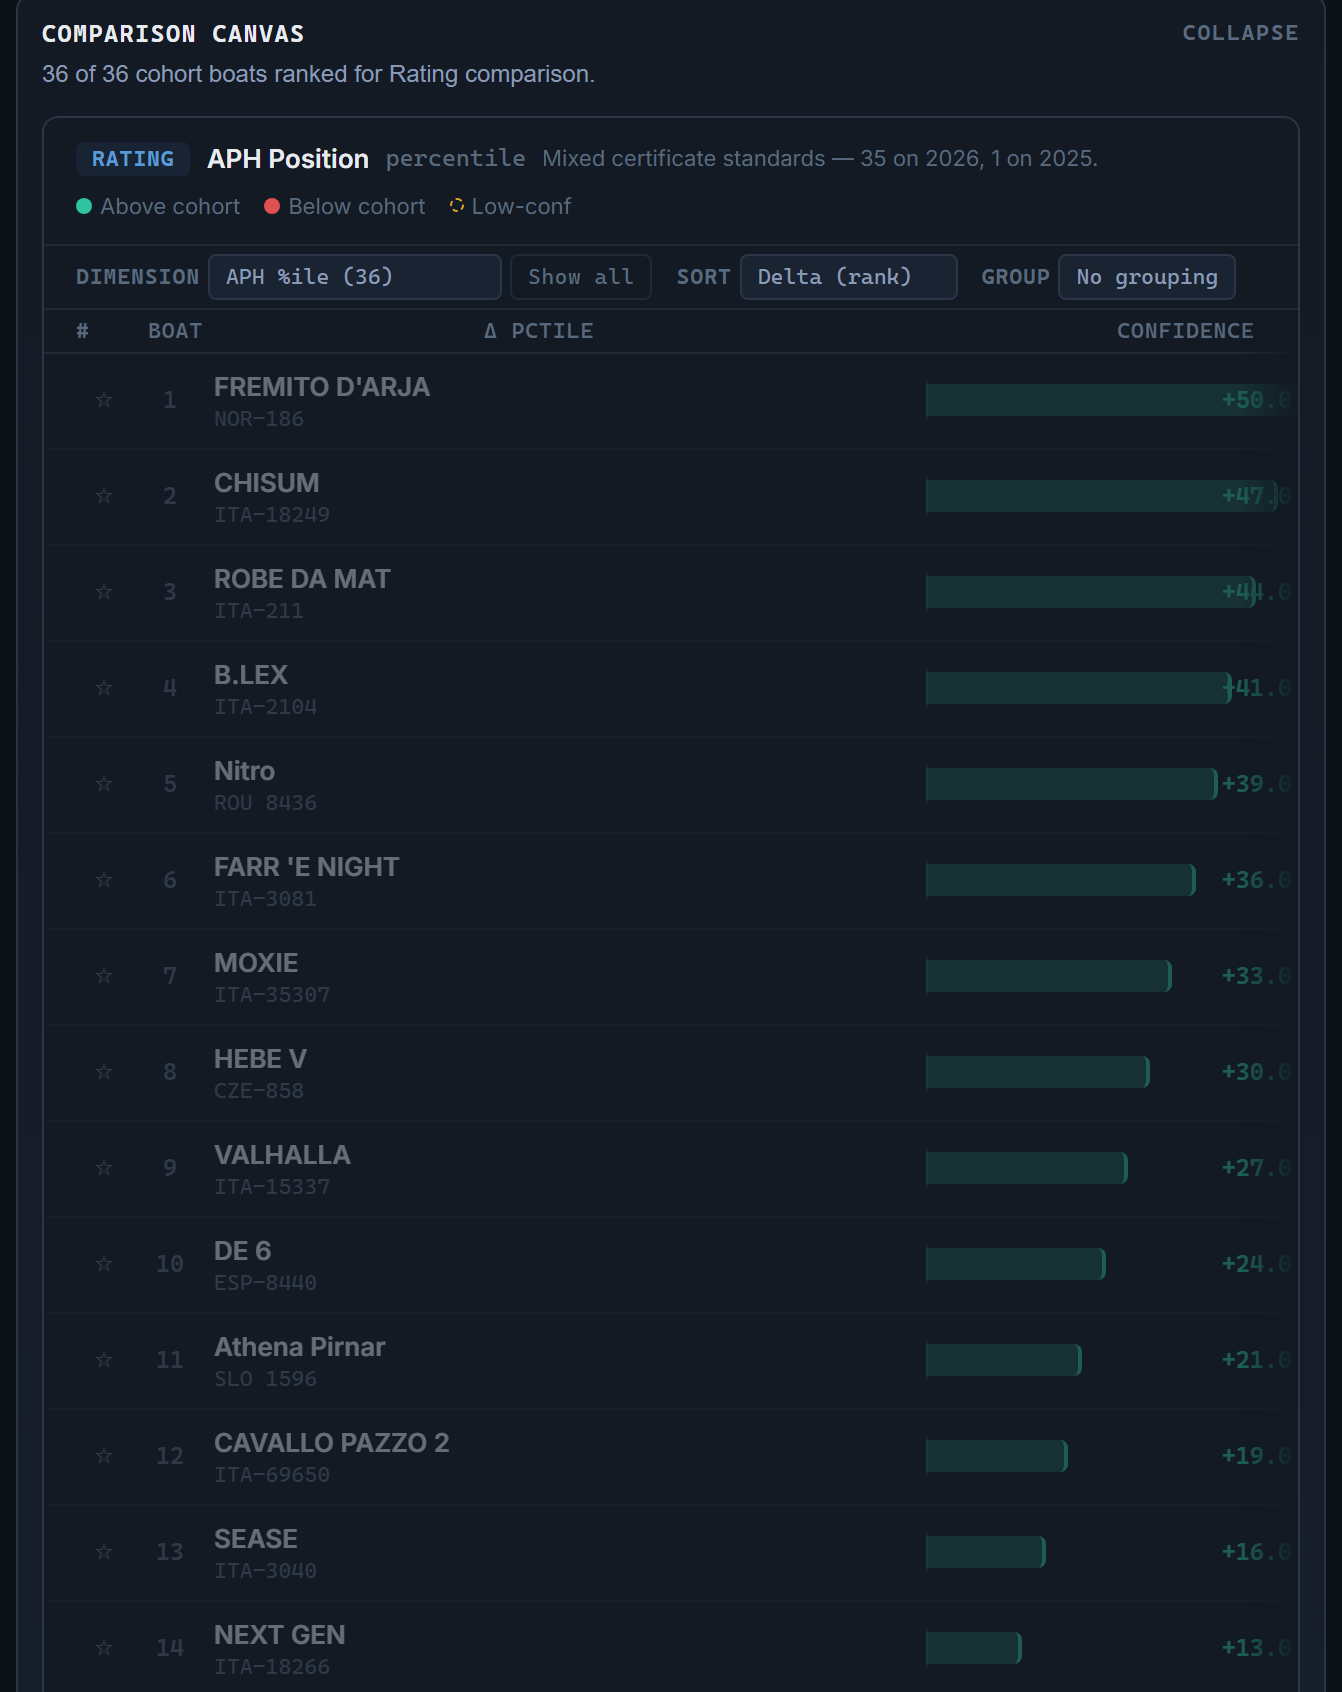
Rank the whole class on the dimension you care about.
The same table and the same boats, asked two different questions. Change the dimension and the order changes — which is the point. A ranking means something only once you have said what it ranks on and who is in it.
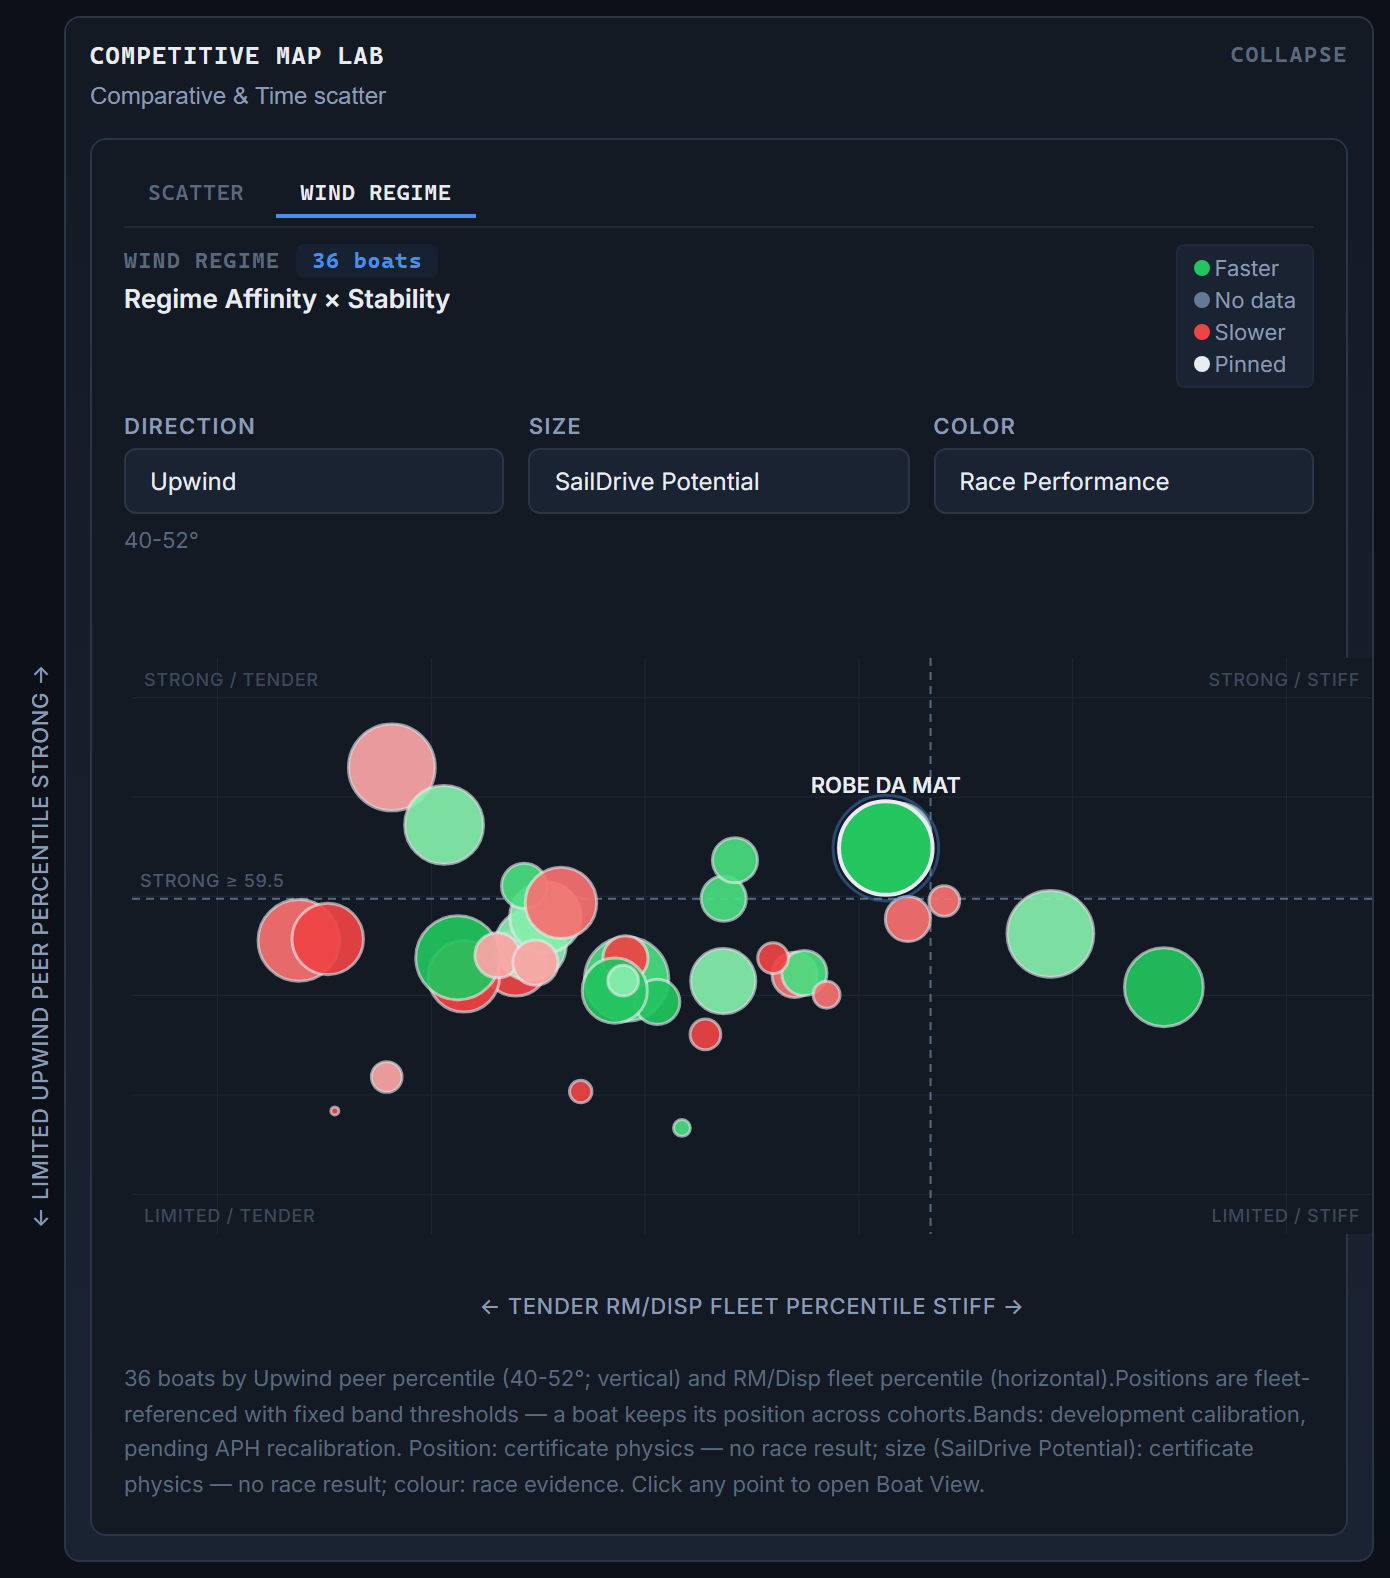
See where the class sits on stability and VMG balance.
A ranking gives you an order. A map gives you a shape — which boats are built to work upwind in a breeze, which are downwind-biased in light air, and how far apart they actually sit.
Position carries the design question. Color carries how the racing went. Size carries a third reading entirely, so one picture answers three questions without stacking three charts.
How far does the method go?
Expert Cohort Studies
What a composite index is actually made of, which population every figure is computed against, and where the analysis says plainly that it does not know.
Build a cohort
How a cohort gets built in the first place — filter to an event, narrow to a class, and every dimension recomputes to your selection.
Run it on your own design.
Design Benchmarks is the naval-architect workspace for this analysis. It is a planned product — access is by request.