What a certificate can answer — and what it cannot.
A cohort study reads two things: the fleet’s public rating certificates, and the official race results. That is the whole input.
There is no telemetry behind it — no boat-speed logs, no start-line data, no maneuver counts. So it does not reconstruct the racing, and it says so first rather than last. No quantity in it is a crew measurement.
What it can do is ask a narrower and more answerable question: how much of a finishing order is already visible in the paperwork the fleet filed before the racing started — and how much is not.
Every reading carries its own sourcing: which certificate was used, whether it covers the race window, how many races back it, and whether the independent baseline agrees.
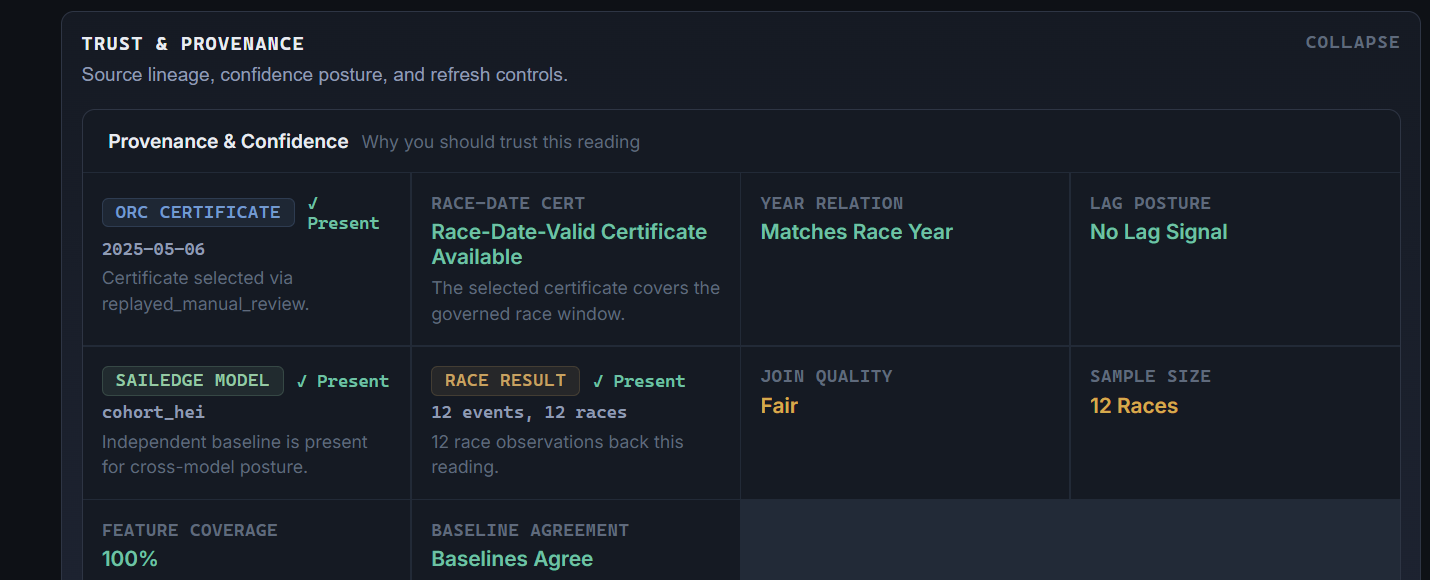
A number means nothing until it names its population.
The same event produces several different groups of boats, and they are not interchangeable. A study that does not say which one a figure stands on has not reported it.
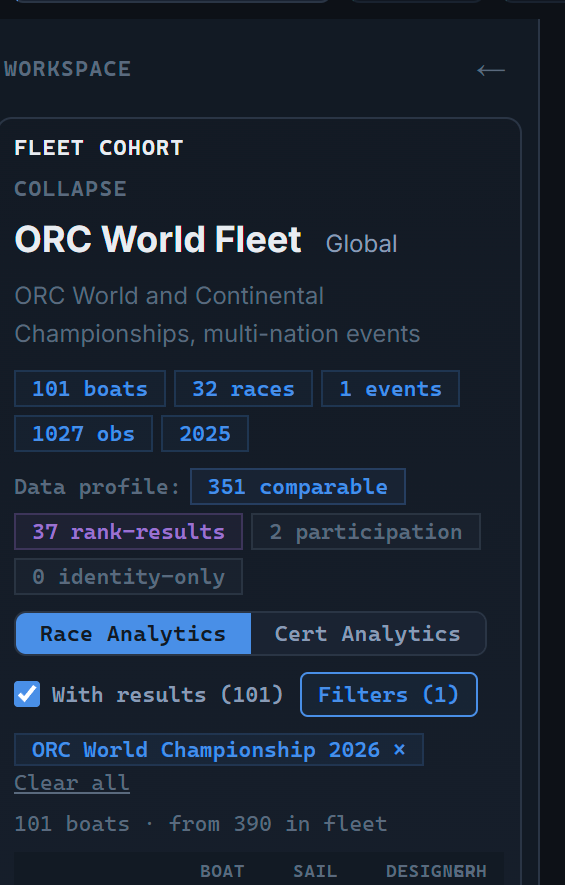
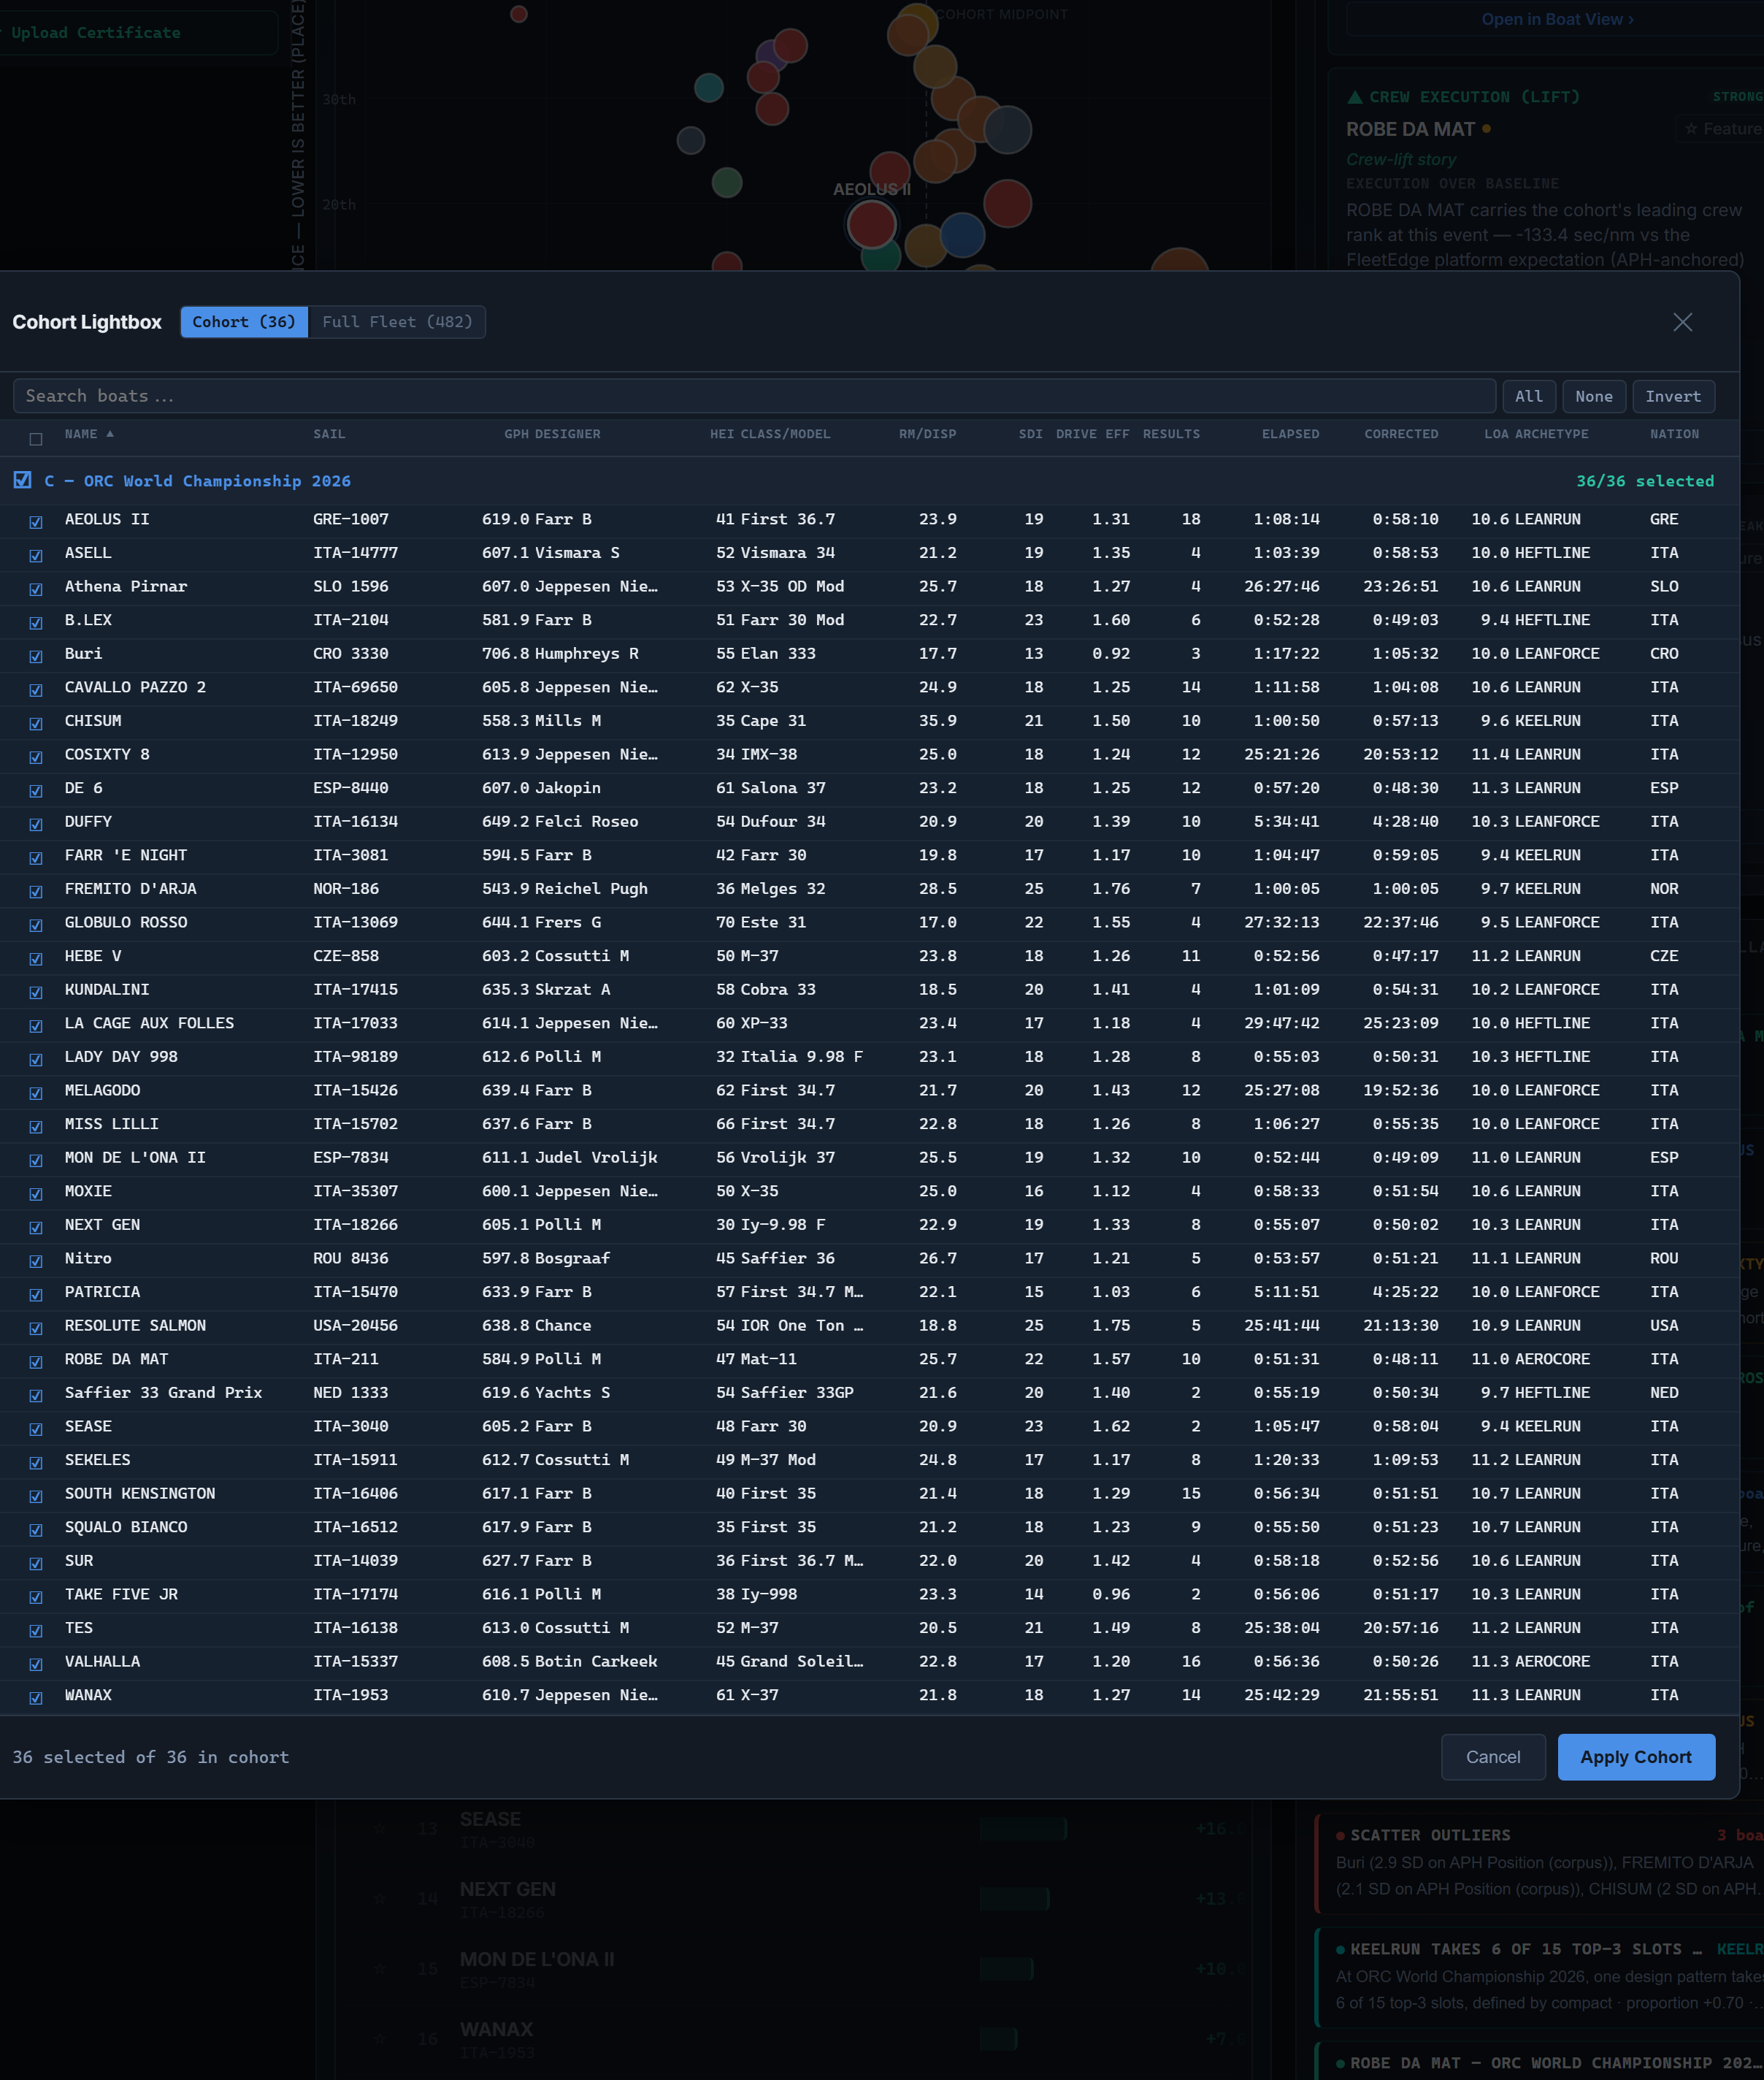
At one recent world championship class, five distinct populations were in play at once — the official scoreboard, the amateur division with its own series table, the boats that could be joined to the analytics dataset, the set a product page happened to render, and the selection that happened to be ticked on screen.
Only the third is an analysis population. The last is a display artifact: it excluded the event winner entirely. Read a percentile against it and the number is not wrong so much as meaningless.
Potential, measured before the result is consulted.
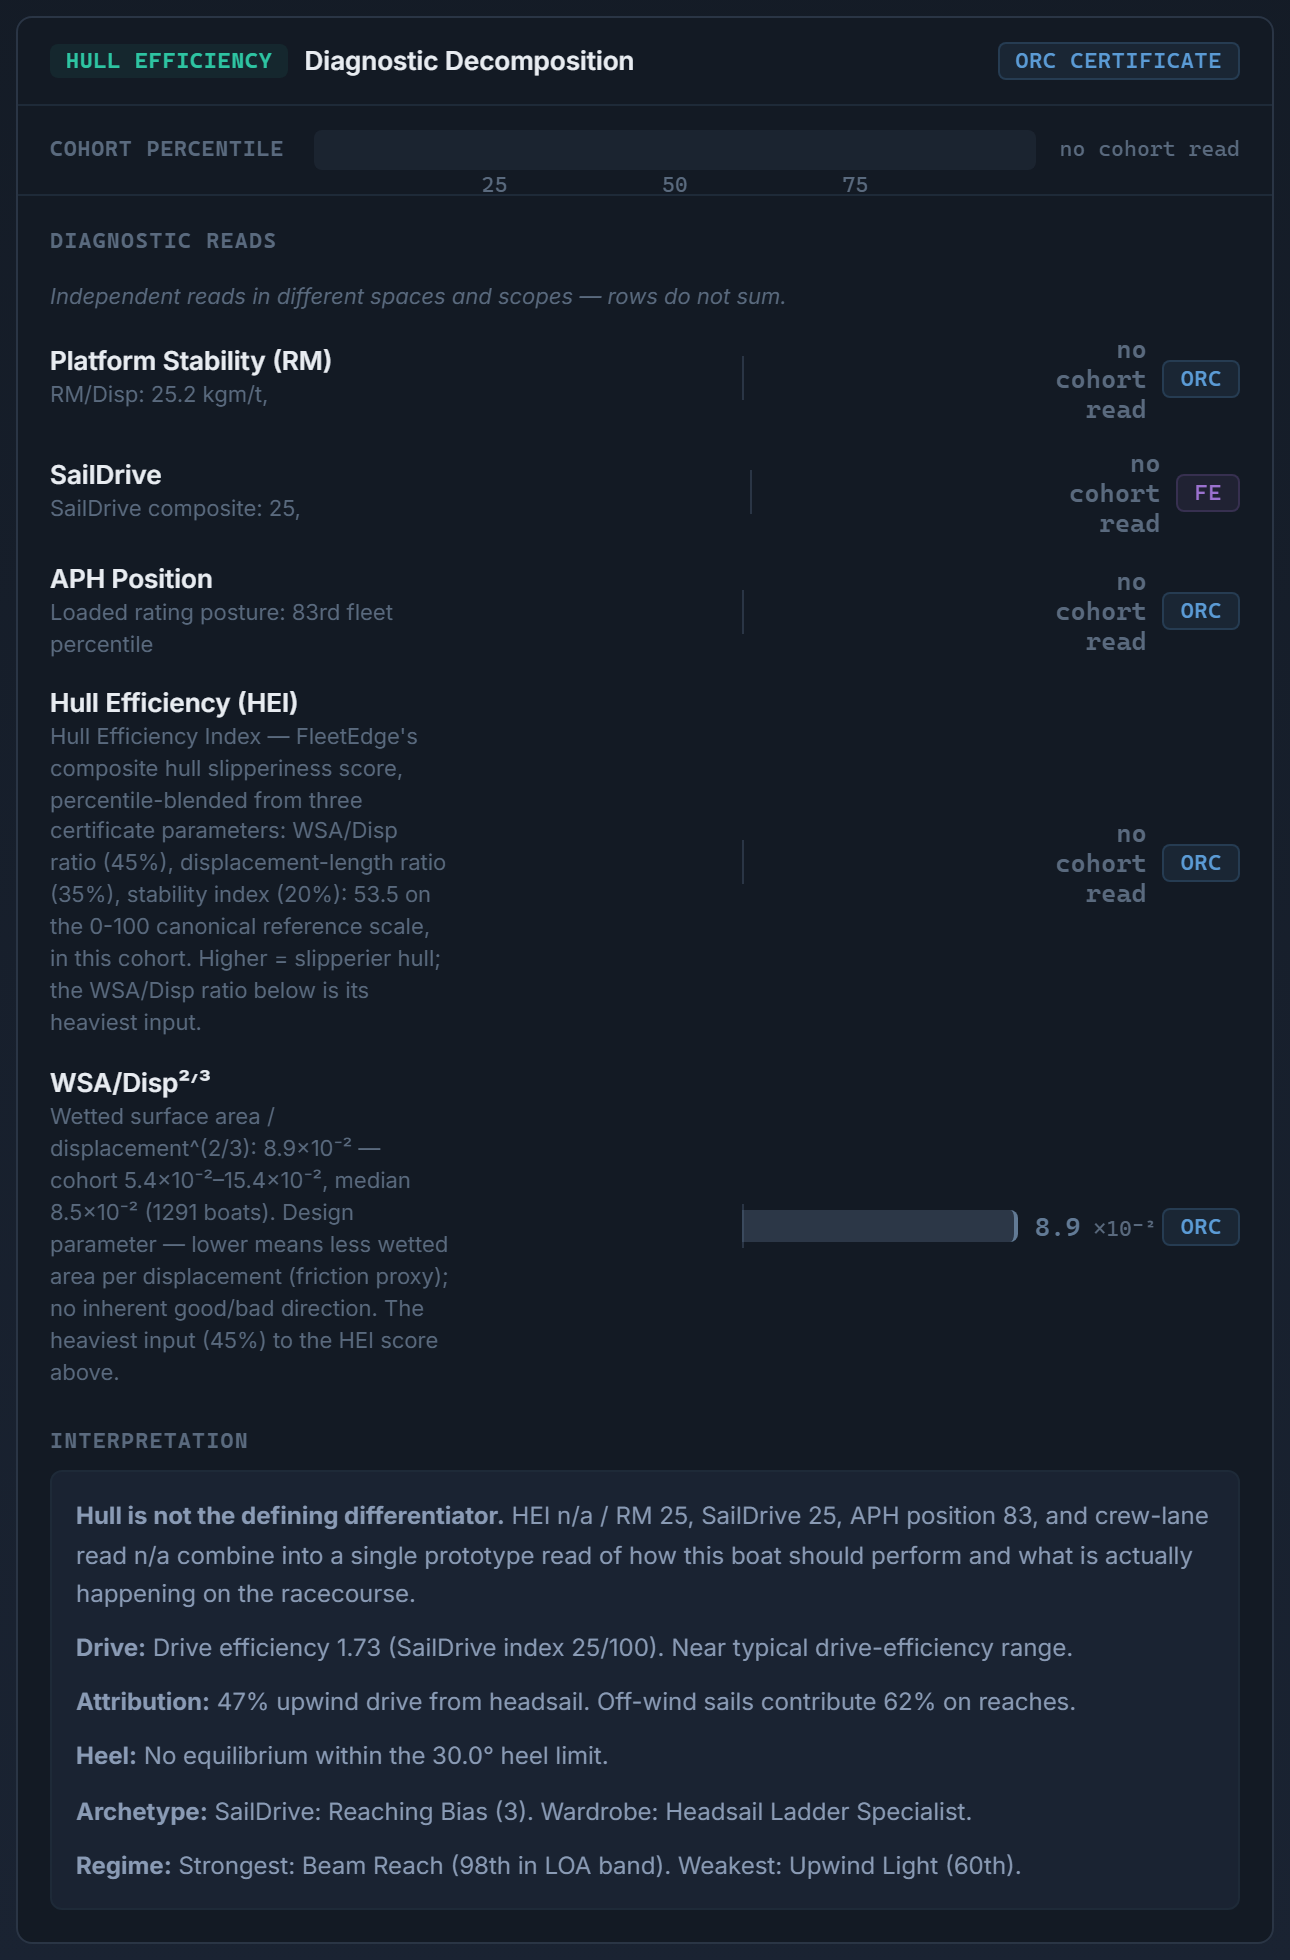
The platform baselines are computed from the certificates alone — hull-efficiency composite, wetted-surface loading, righting moment against displacement, sail drive (the rig's drive potential on a 0–100 scale), drive efficiency, the rating itself, and target VMG upwind and down.
Every one of them is derived before any finishing position is looked at. That ordering is the point: a measurement taken after the fact can always be made to agree with it.
These are descriptions of a platform, not forecasts of a result. The study is careful to keep those two things apart, and so is this page.
A composite is only as good as its willingness to be taken apart. Each component carries its own value, its own direction, and a tag naming where it came from.
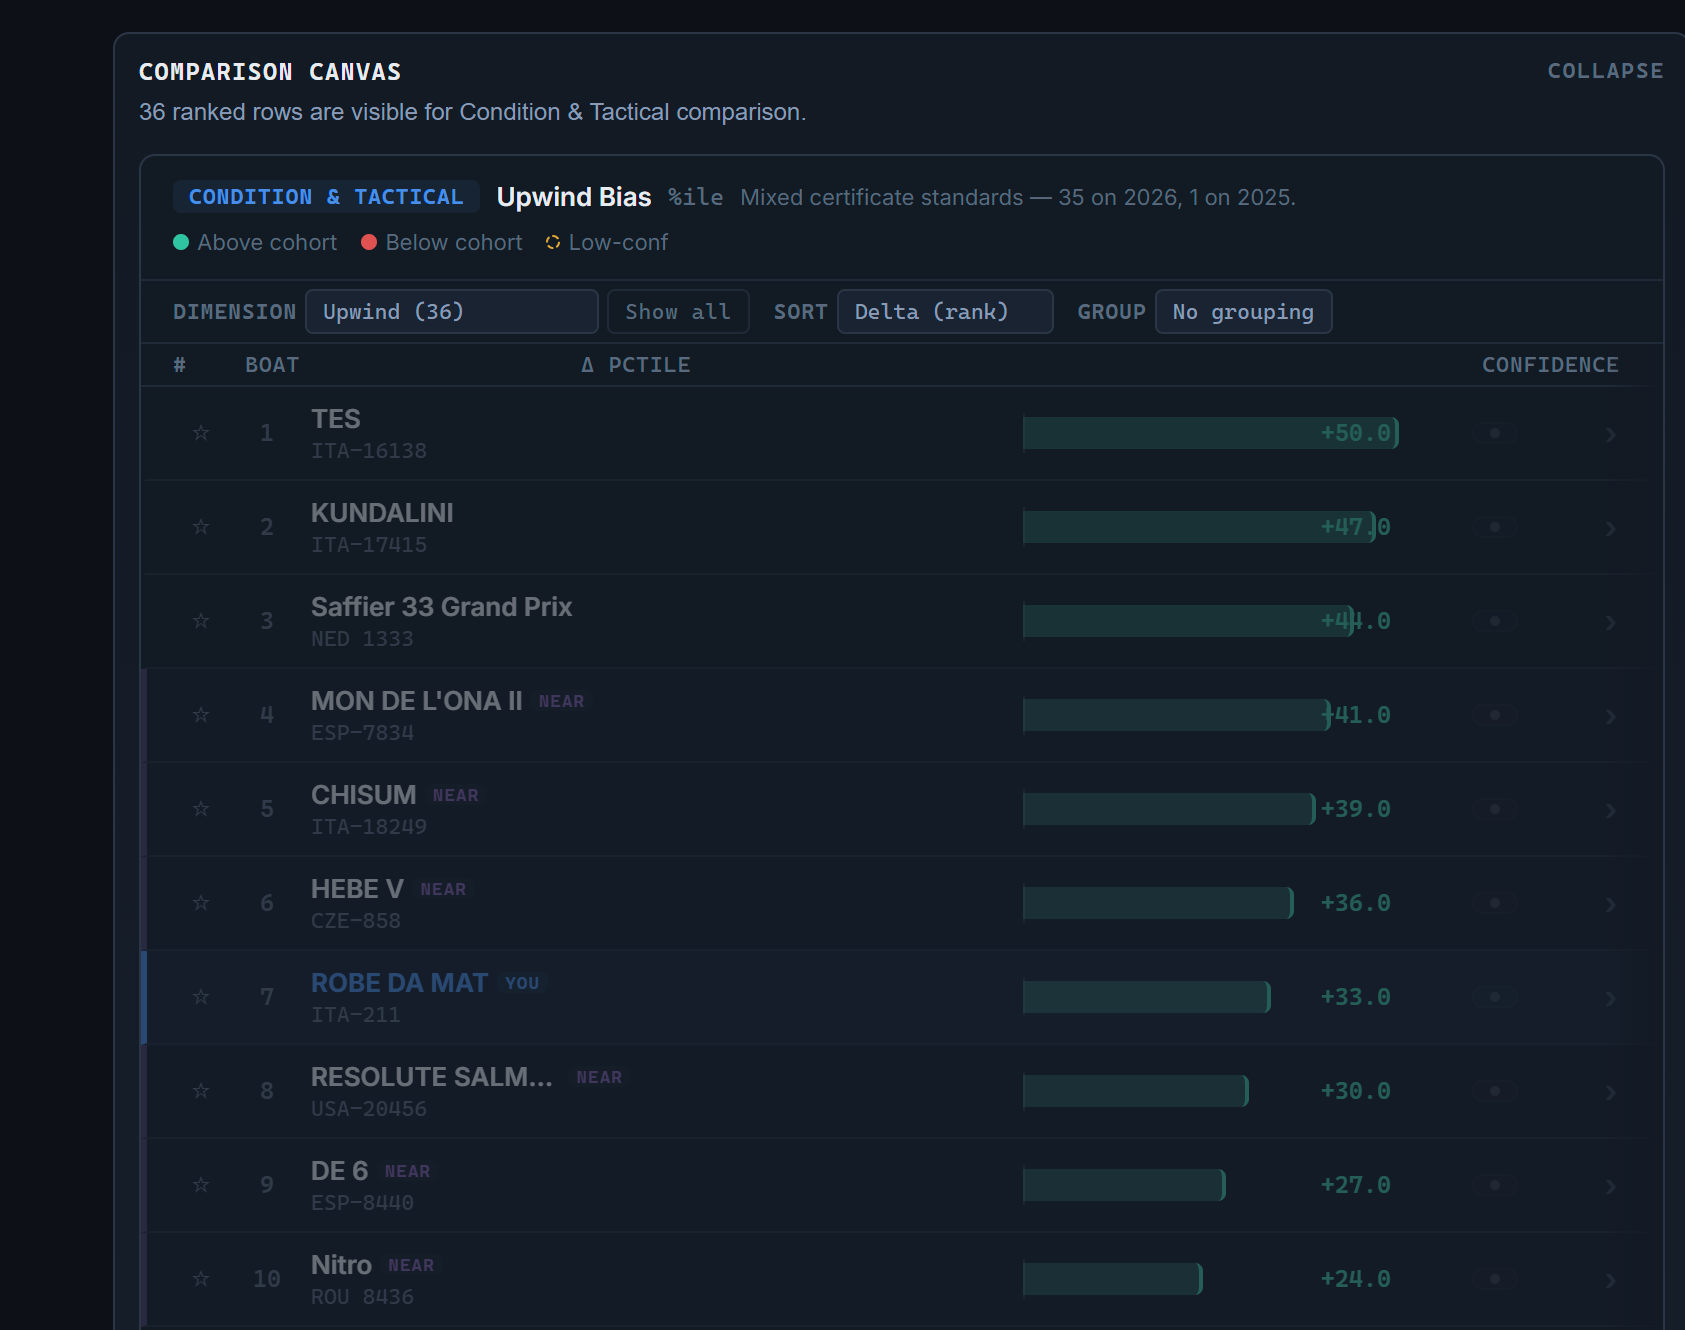
Hold the geometry. Change one channel.
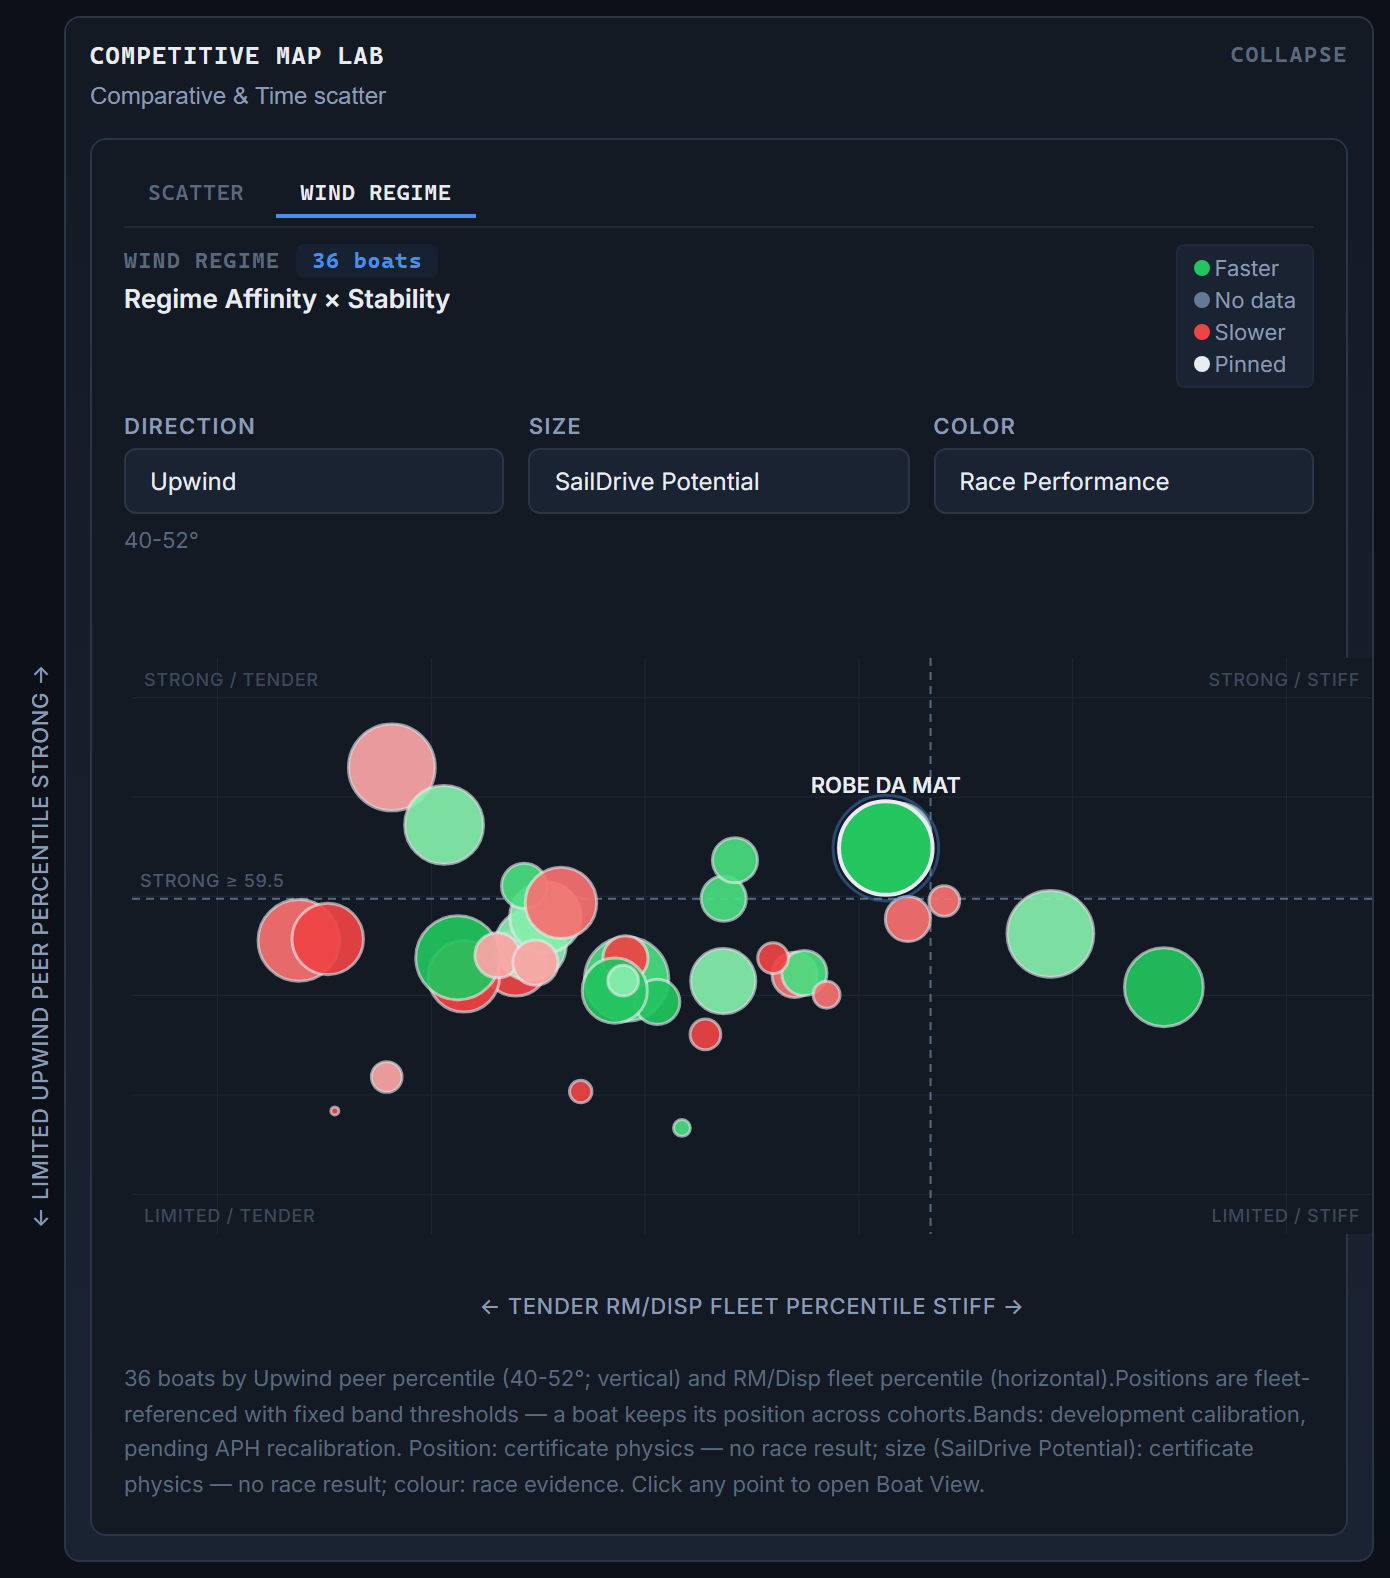
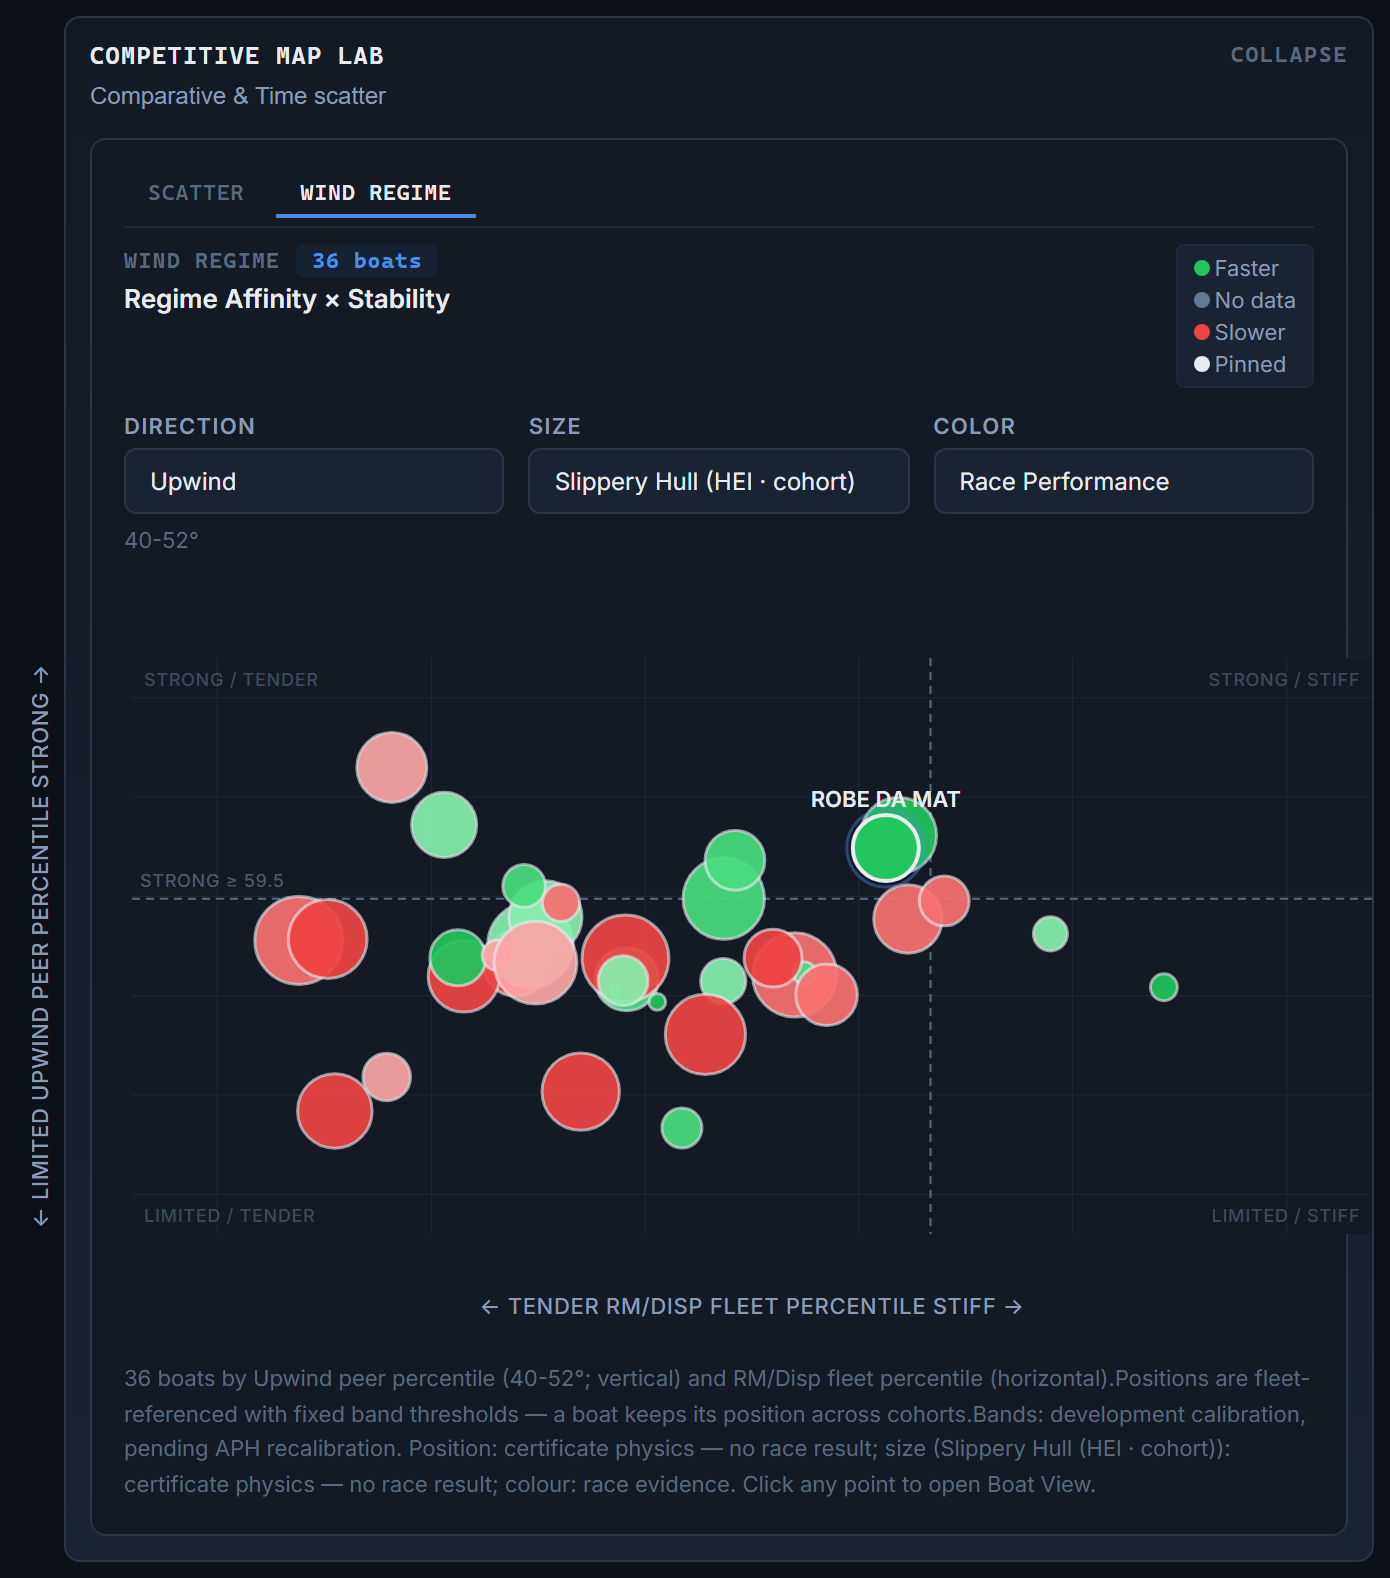
Both plots below are the same class, the same axes and the same positions. Only the size channel differs — sail-drive potential on the first, hull efficiency on the second.
Read as a pair they answer a question neither answers alone: whether a boat’s place in the wind-regime plane travels with its drive or with its platform. That is a controlled comparison, available because the geometry is held fixed rather than redrawn.
The counter-cases are published too.
A screening result is only as credible as the examples that cut against it — so a cohort study is required to print them.
At the ORC World Championship 2026 Class C, the highest hull-efficiency composite in the entire analysis population belonged to RESOLUTE SALMON — and she finished twenty-second. MELAGODO carried a composite higher than every platform on the podium and finished fourteenth, while placing fifth in the amateur division. LADY DAY 998 won that division and took fourth overall on a slower rating than any podium platform, with nothing in her row that shouted. Boats and finishing positions are named as supported by FleetEdge’s versioned capture of the event scoreboard, which labels these standings Provisional as published; naming implies no current official standing, endorsement, or continuing status.
The study’s own conclusion from that: the composite lane simply is not where this event was decided. A method that can produce that sentence about its own headline measure is a method worth reading.
What it can claim, and what it cannot.
The most useful page in a cohort study is the one that draws the boundary, and it is written in the study rather than left to the reader.
It can claim
The scoreboard facts as captured — and where the official service still labels a result provisional, every claim built on it carries that label too. That the platform measures order a fleet at fleet scale, on a named population, with the uncertainty printed. And that every figure regenerates from locked, checksummed sources.
It cannot claim
Why one boat beat another — the unexplained remainder is described and bounded, not explained away. Anything about crews. Anything conditioned on measured weather, when none is in evidence. Or that the certificate edition analyzed is the edition that actually raced, where the paperwork says otherwise.
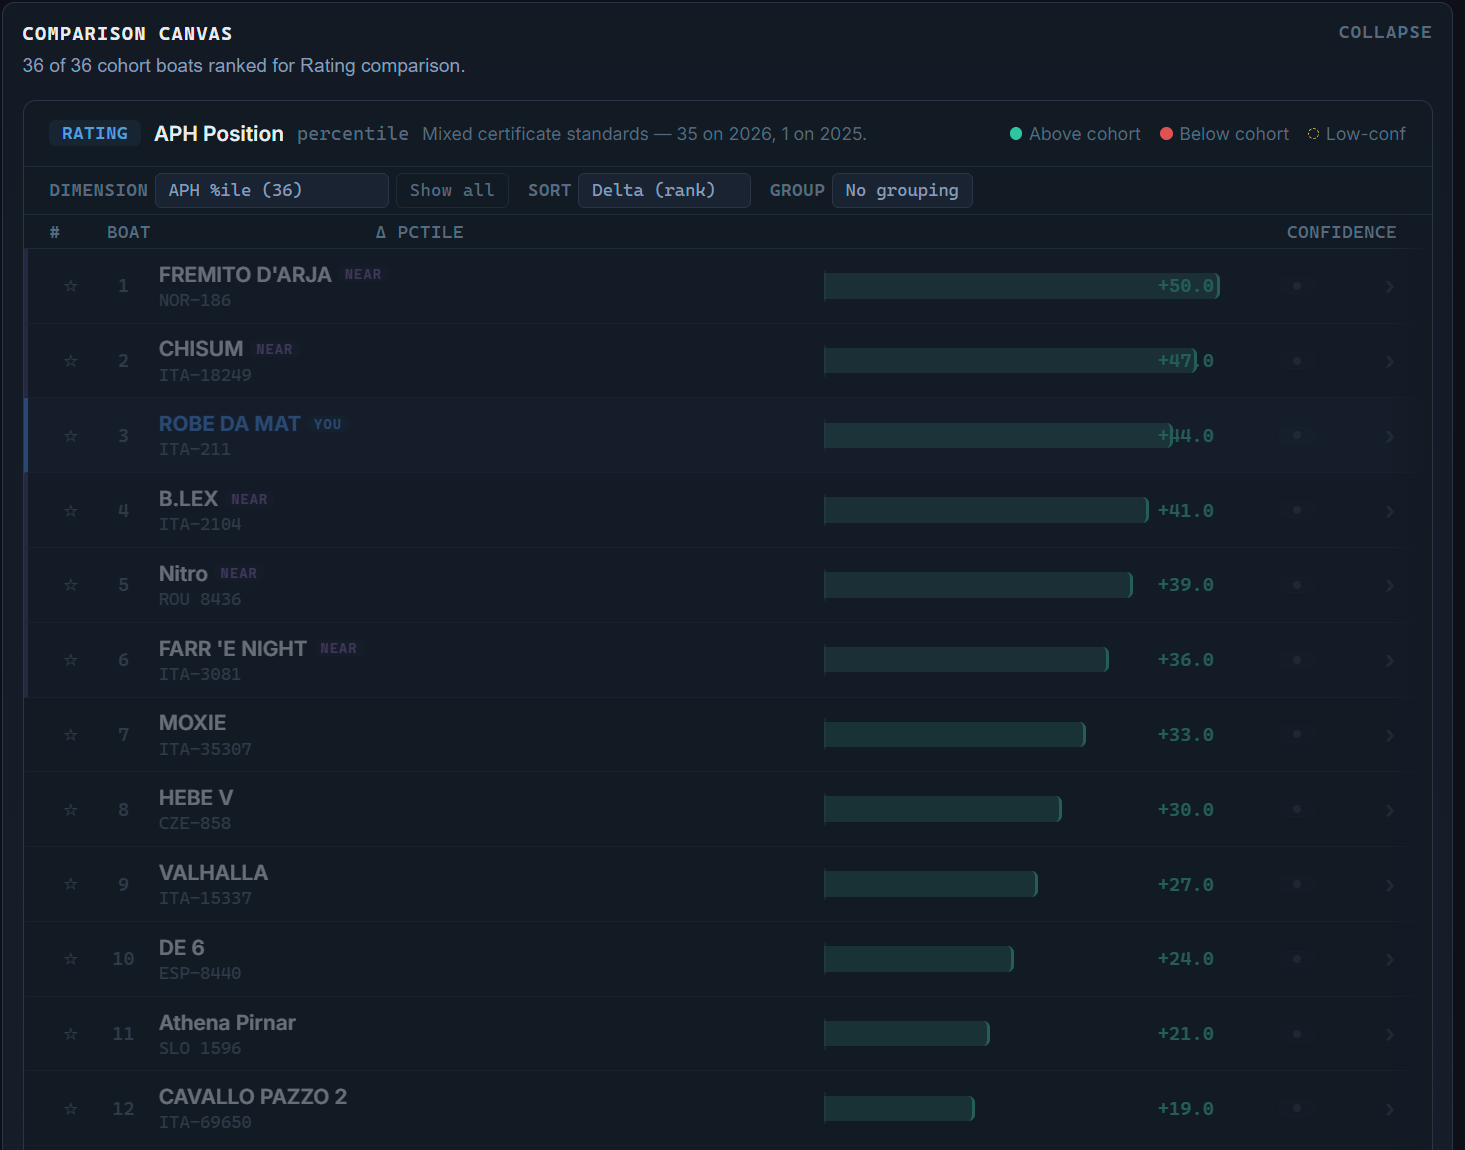
One more, and it applies to this page: the screenshots here illustrate the surfaces. They are never the source of a number. Every figure in a study derives from the locked, checksummed data snapshot behind it — the study’s frozen extract — which is why a study can be regenerated and a screenshot cannot. And the boundary that frames all of it: a study alters no rating and no score — ORC remains the rating and scoring authority.
Put it against your own drawings.
Design Benchmarks is the naval-architect workspace for this analysis. It is a planned product — access is by request.