Your boat has physics. Your race had conditions. Everything else? That's you.
The Performance Potential Index decomposes sailing performance into three measurable, explainable pillars.
Every fleet has a fingerprint.
From the Solent to the Aegean — see how the physics plays in your waters.
Hidden ShapeThe hidden shape of the fleet.
The kinds of boat that keep appearing when every hull is measured the same way.
The shape of the fleet, before the scoreboard has anything to say.
Physics. Conditions. Crew.
Every race result is shaped by three forces. The PPI measures each one independently — giving racers, naval architects, and analysts a way to see exactly where performance comes from.
Physics Potential
Hull and sail plan efficiency from ORC polar physics. SailEdge Delft-derived force-balance analysis captures what the design gives you — independent of who sails it or where.
Archetype Condition Fit
How well the design type suited the conditions it met, ranked against its cohort (the boats a figure is computed over — a real entry list, a class, a fleet — named on every figure). The 8-archetype FleetEdge engine crossed with ERA5 weather data reveals whether the conditions favored or challenged the design.
Crew Execution
The residual. Everything left after physics expectations and weather context are removed. Across repeated observations (one boat's result in one scored race, joined to the weather of its race window) it becomes a diagnostic execution signal — tactics, boat handling, sail selection, preparation — not a causal measurement of any single action.
Design PPI and Race PPI.
Design PPI covers the 9,591 ORC boats scored (July 2026 — how the counts reconcile) — computed from ORC certificate physics and weather-model condition fit (how well the design suited the conditions it met), race data not required, including boats that have never raced at all. Design PPI reveals the structural potential a boat carries before it leaves the dock.
Boats whose race data supports scoring receive the full Race PPI — adding the one dimension that cannot be computed from a certificate: crew execution. It measures what happened against what was expected — in the current publication, 1,244 boats carry a crew execution residual (what remains after the boat's evaluated pace is accounted for — negative is faster, in s/nm).
The two scores are not one story wearing two names. At the most recent ORC World Championship’s Class C, the Design PPI ladder’s leaders and the crew board’s leaders barely overlapped — the class winner sat mid-ladder on the design score and at the head of the crew board. The pillars measure different things, and the boards show it.
What a PPI breakdown looks like.
- archetype (one of the fleet's eight recurring design types)
- sail drive index (the rig's drive potential on a 0–100 scale)
- sec/nm (seconds per nautical mile — pace normalized by distance)
Every PPI score decomposes into its constituent pillars. Here is how the three-pillar attribution works for a single boat — an illustrative example: a LEANRUN archetype racing in transitional Mediterranean conditions.
The boat's physics potential is strong — SailEdge places the sail drive index at the 93rd fleet percentile. Conditions favored the LEANRUN archetype, adding an 11.2 sec/nm advantage (79th percentile). But the crew execution residual tells a different story: 6th percentile, well below fleet. Four observations from two venues — the estimate is directional, not definitive.
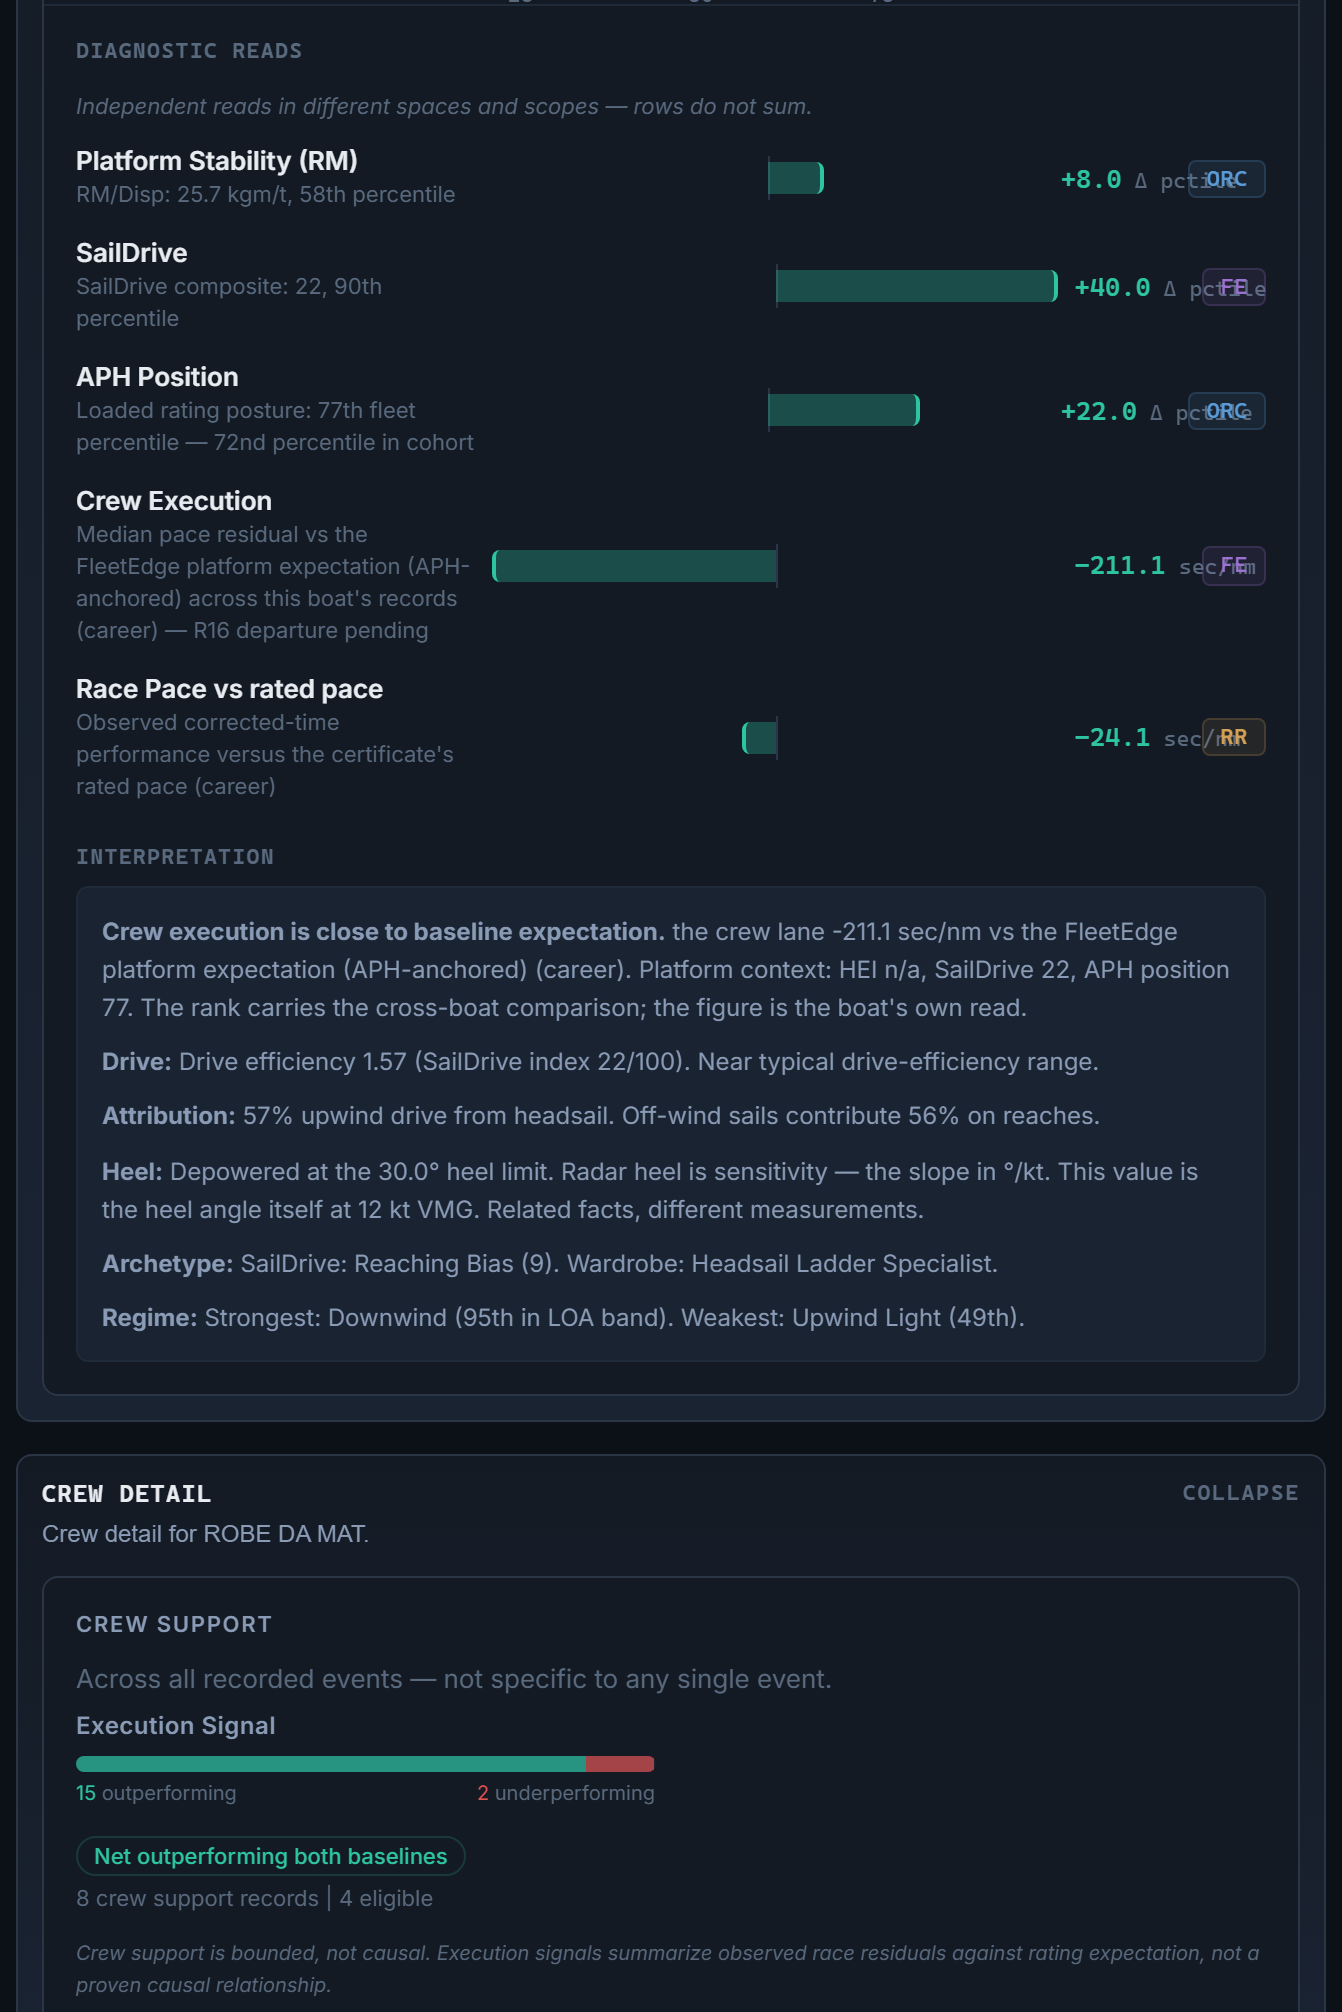
What this tells you: Strong design, favorable conditions — crew execution is the limiting factor. But with limited observations, the score is directional. More races will sharpen the estimate.
No black boxes.
Every PPI score shows its reasoning — what contributed, how confident the estimate is, and what it does not measure.
Reason Chain
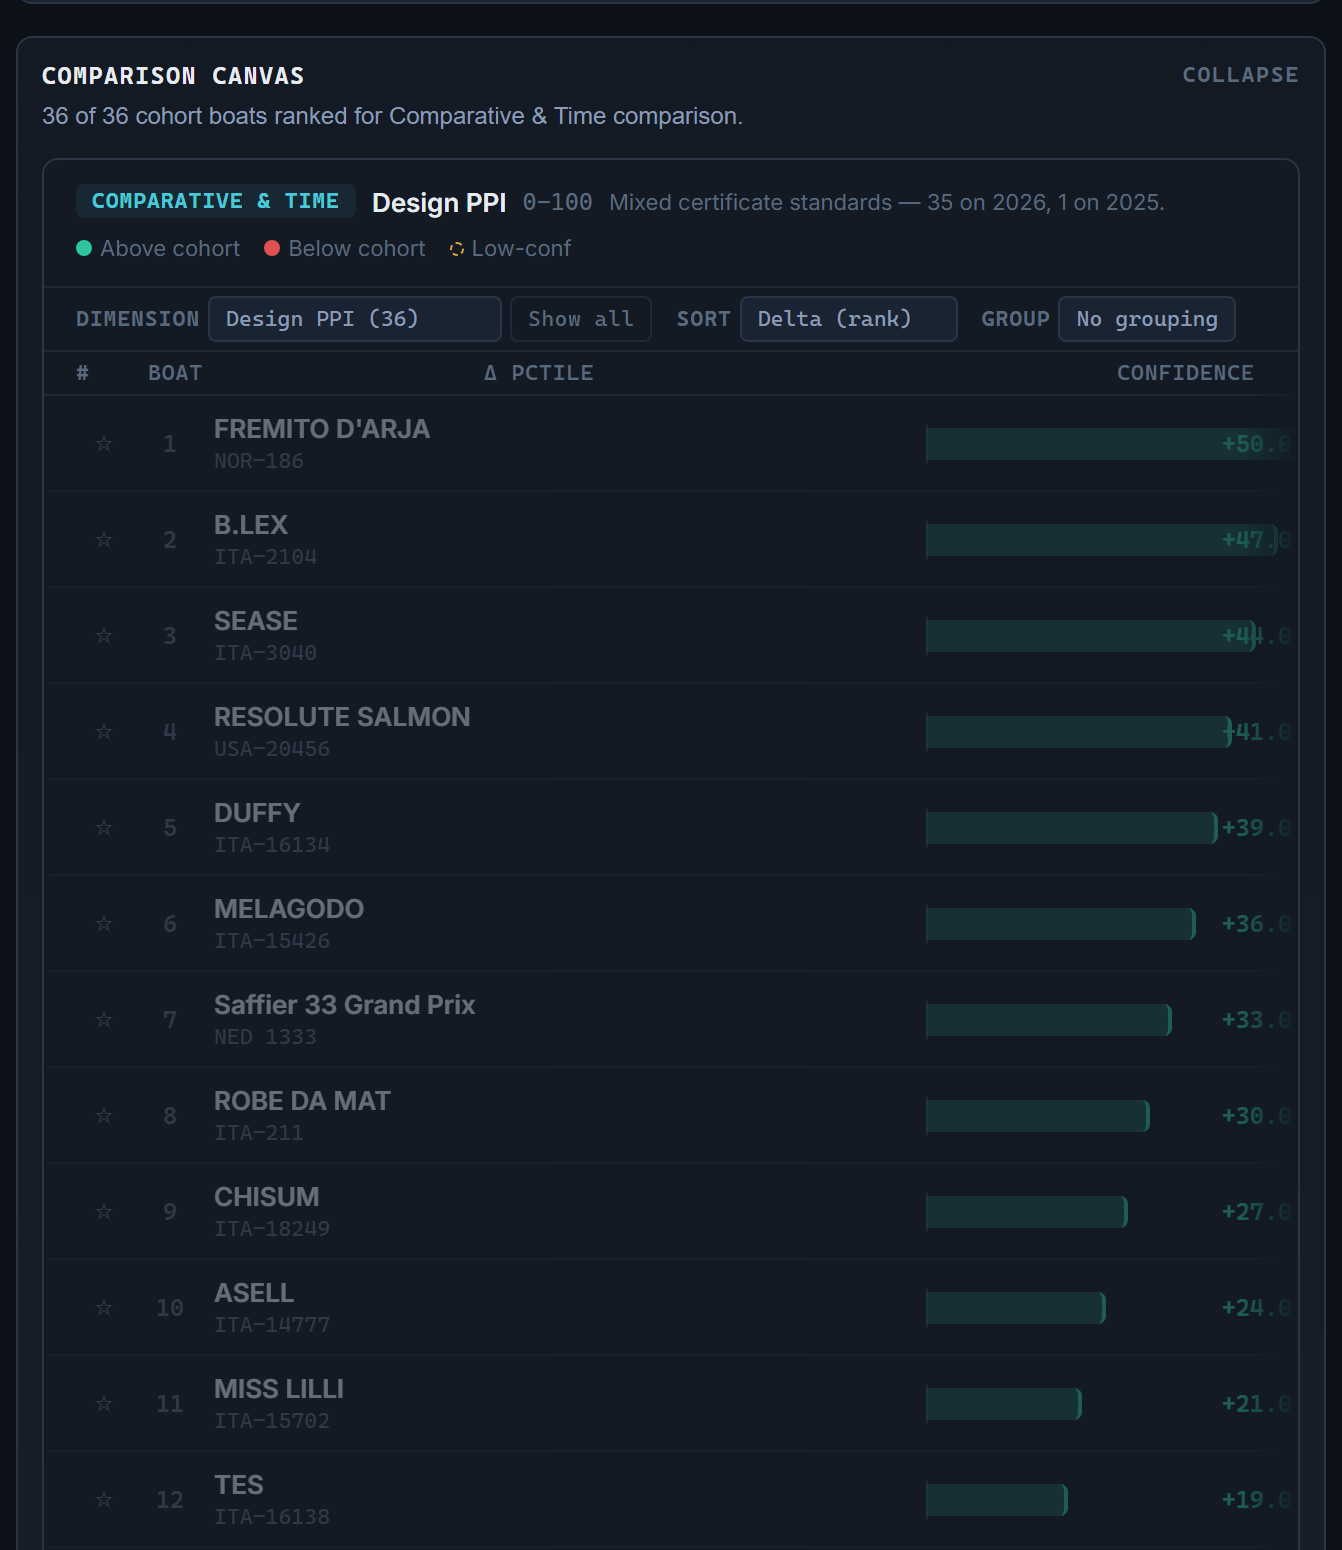
Each score traces to its data sources — ORC certificate physics, FleetEdge archetype assignment, ERA5 weather match, and observed race performance. Follow the reasoning from composite score to individual data points.
Confidence Tiers
Every component receives a confidence level: low, medium, or high (with a sparse tier when observations are too thin). Overall confidence follows the weakest link — a strong design score cannot mask an uncertain crew estimate.
Limitations
Scores state what they do not measure. A single-venue boat is told its estimate may reflect venue-specific factors. Boats in the 40th–59th percentile are described as "mid-fleet" — no false precision.
The data behind the scores.
Physics from ORC polar analysis, conditions from ERA5 weather data, crew from the residual after both are removed.
Go deeper.
See Performance Potential in the Greece ORC fleet.
Greece ORC racing brings performance potential into sharp relief — see how the physics meets the fleet's regime and rivalries.
Explore Greece ORCPhysics. Conditions. Crew. Accounted.
The Performance Potential Index — a three-pillar decomposition of the race result. Every score explainable. Every confidence stated.