Team Diagnostics
Decompose your boat's performance into what the design gives you — and what your crew adds.
Every fleet has a fingerprint.
Your boat against the rivals who matter — find the waters that shape your next race.
Hidden ShapeThe hidden shape of the fleet.
The kinds of boat that keep appearing when every hull is measured the same way.
The shape of the fleet, before the scoreboard has anything to say.
In beta as a product. This is the methodology behind the Team Diagnostic — the private, per-boat crew-versus-boat decomposition for racing teams and coaches. See Team Diagnostic →
When you examine a single boat in FleetEdge, you see its performance decomposed across the FleetEdge dimension families (the nine groups of FleetEdge readings — six on the Fleet View ribbon — each reading one aspect of the boat or its racing) — Comparative & Time, Hull & Platform, Sail Performance, Rating & Classification, Crew & Execution, Condition & Tactical — compared within its archetype (one of the fleet's eight recurring design types), the fair-comparison basis behind every FleetEdge view. Each dimension tells a different part of the story.
Traditional analysis gives you a corrected-time result and a position in the fleet. FleetEdge gives you the dimensional breakdown behind that result — which design characteristics contributed to the outcome and where the crew's execution made the difference. Every score in the diagnostic includes a confidence level and the data sources that produced it — so you know what to trust and where to investigate further.
Family by family. One boat.
Hull & Platform
How efficiently the hull converts power into speed, how stiff it is, how far it heels on the beat and how fast heel grows with the breeze, where the helm balances, and the certified geometry all of that rests on — every reading from the ORC certificate and the SailEdge physics evaluation (pace computed from the boat's certificate physics) of it, no race result required.
Sail Performance
How much drive the sail plan develops and how efficiently, how that drive is shared between the headsail and the off-wind sails, the breadth of the wardrobe, and the upwind and downwind VMG the physics evaluates at twelve knots — with the force-balance model behind the drive and VMG readings.
Rating & Classification
Where the boat's APH (the certificate's single-number rating, as a time allowance), the primary rating dimension, sits in the fleet's rating distribution, as a percentile, read from the certificate alone; the angle-specific scoring allowances behind it say where in the wind range the rating expects the boat to perform.
Your boat in context.
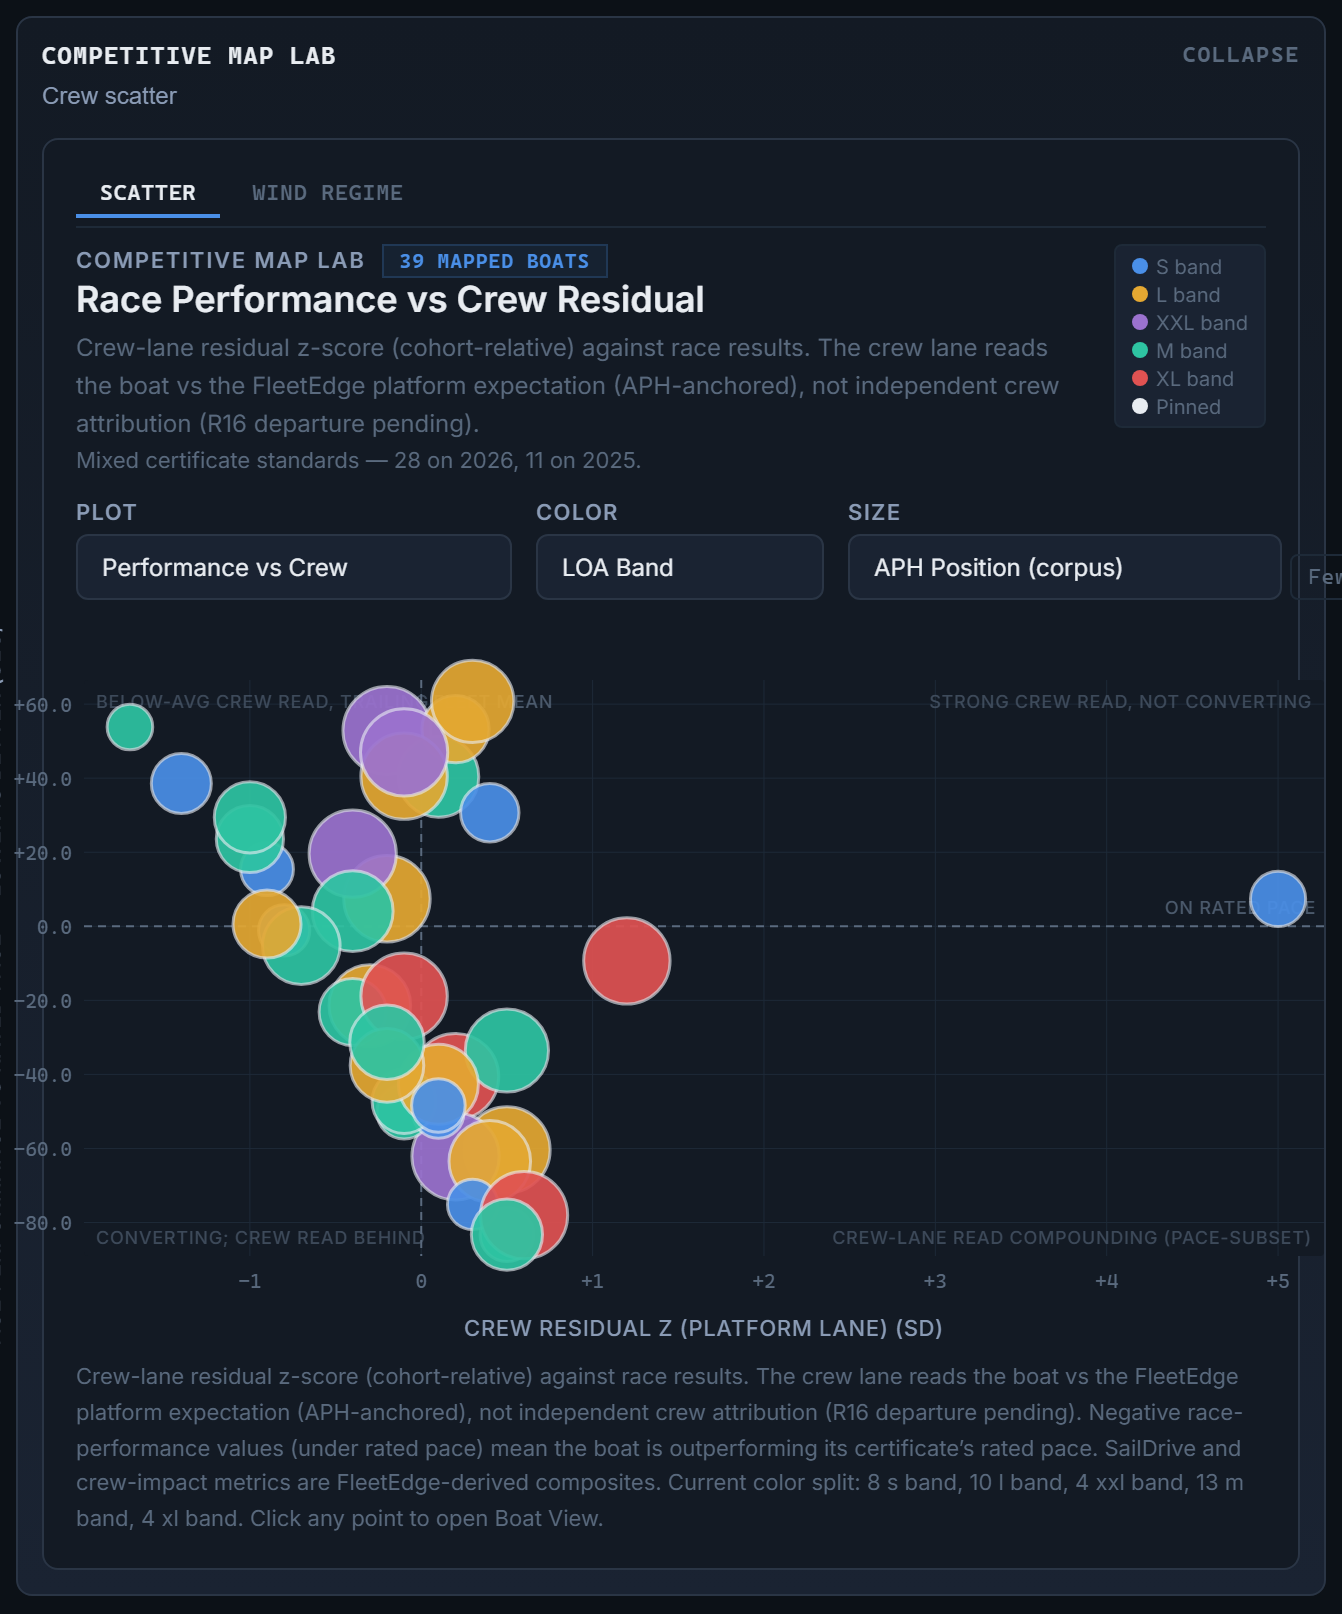
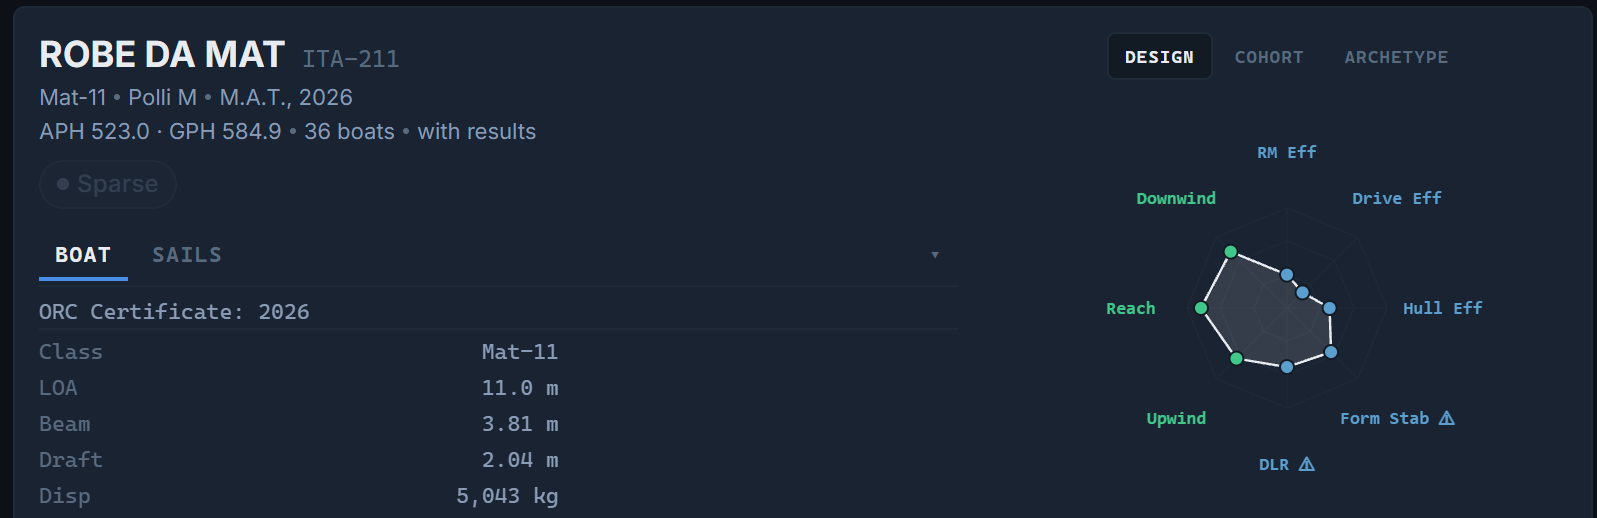
The Boat View places your vessel within its archetype cluster — showing exactly where your design sits relative to boats of a similar kind. You see dimensional strengths and weaknesses as percentile positions within the fleet. The frames below show the kind of fleet-level view that context comes from, and the boat-level identity card such a view opens onto.
Every dimension is referenced against the fleet distribution, so a hull efficiency value tells you not just a number but a position — faster than 73% of the fleet, or in the top quartile of your archetype.
What the crew adds.
When you account for the design contributions — Hull & Platform, Sail Performance, and Rating & Classification — what remains is the crew's contribution: the Crew Residual. Tactics, execution, preparation, and the countless decisions that separate identical boats on the racecourse. The residual's full story — how it is derived, its confidence posture, and what it can and cannot attribute — lives on Crew & Execution.
The Crew Residual is live. Boats whose race results carry elapsed time and a usable course distance receive the measurement — negative means faster than the evaluated pace (the pace the certificate physics say the boat should hold), so the most negative residual is the strongest crew reading. The approach is validated, and the signal sharpens as the race-results dataset grows.
Go deeper.
Fleet Analytics
See the fleet context. Explore archetype patterns and dimensional distributions across the full ORC fleet.
Hull & Platform
Understand the Hull & Platform family — hull efficiency, stability (how much righting moment the boat carries relative to its displacement), heel and geometry: the dimensions that define your boat's speed potential through the water.
What the diagnostic can and cannot say. It decomposes a result into design contribution and crew execution (the PPI pillar no certificate can compute — what happened against what was expected) at a stated confidence. It cannot attribute the crew share to any single action or sailor, and with few observations (one boat's result in one scored race, joined to the weather of its race window) the residual stays directional — a place to look, not a verdict.
The diagnostic alters no rating and no score — ORC remains the rating and scoring authority.
Know your boat. Measure your crew.
FleetEdge decomposes performance into design and execution — so you know where to improve.