How It Works
Three data authorities. Fifty-two dimensions. Eleven archetypes.
Every fleet has a fingerprint.
One physics model. Every fleet. Every result — find the waters that made it possible.
Hidden Shape52 dimensions distilled into 11 performance archetypes.
How the corpus clusters before the results arrive.
Read the shape of the fleet before the scoreboard reads it.
FleetEdge does not invent data. It triangulates three independent sources that already exist in the ORC ecosystem — the certificate, the physics, and the results — and finds the structure that connects them.
The ORC Certificate.
Every ORC-rated boat carries a certificate — a detailed technical profile that defines its rated identity. Hull dimensions, rig geometry, displacement, stability, and the scoring allowances that ORC uses to establish fair competition.
FleetEdge reads this certificate not as a handicap number but as a multi-dimensional design fingerprint. Each parameter becomes a feature in the analytical model — length-displacement ratio, sail area to wetted surface, righting moment at key heel angles, and the ratios between them.

SailEdge Physics.
SailEdge provides an ORC-anchored force-balance analysis built on the Delft Systematic Series — the most comprehensive set of hull resistance experiments in naval architecture. SailEdge is not a competing VPP.
It is a proprietary force-delta model that takes the ORC certificate polar as its baseline and applies Delft Series physics to compute speed deltas against that baseline for each boat's certificate geometry.
Where the ORC certificate defines what the boat IS, SailEdge physics computes how Delft Series force-balance analysis INTERPRETS the hull form — speed deltas at every wind angle and velocity that become dimensional features in the archetype model.
Race Results.
The ground truth. ORC Scorer events produce elapsed times, corrected positions, and the conditions that shaped each race. When you combine hundreds of race observations across multiple events, the noise of individual races gives way to persistent signal.
FleetEdge ingests results from ORC World Championships, continental championships, and major regattas — over 29,000 race observations. Each observation is a data point that either confirms or challenges what the certificate and physics predicted.
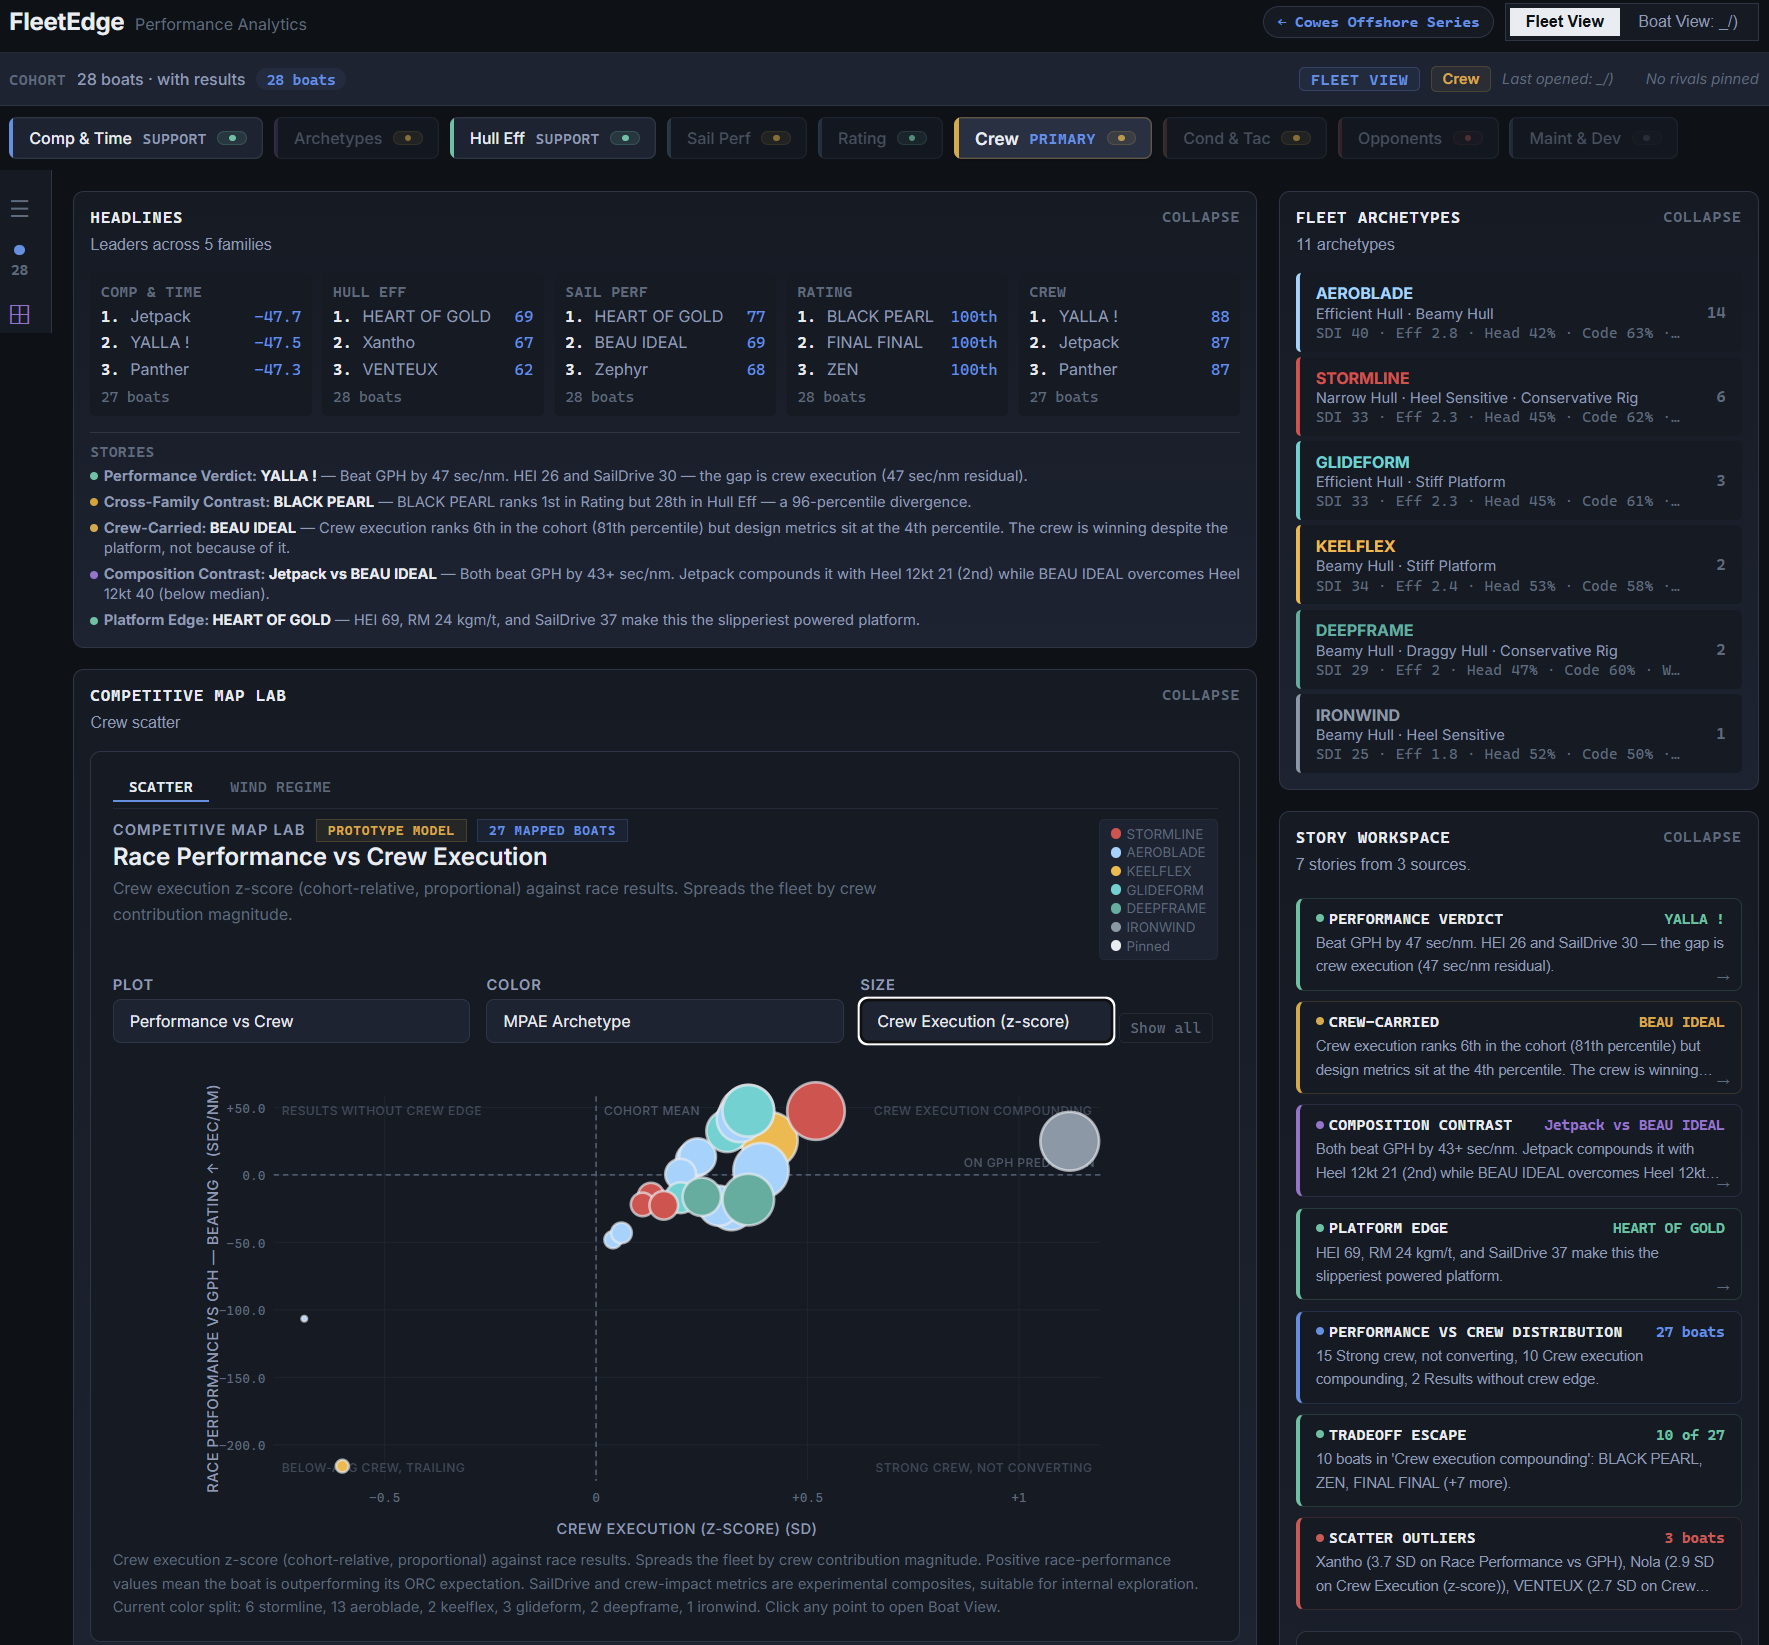
From fifty-two dimensions to eleven archetypes.
The three authorities converge into 52 raw measurement dimensions per boat — capturing hull efficiency, rig performance, stability characteristics, rating position, and the physics deltas between predicted and actual performance.
FleetEdge then groups the boats into the 11 canonical performance archetypes by their structural similarity.
52 dimensions → 11 performance archetypes
Every answer shows its reasoning.
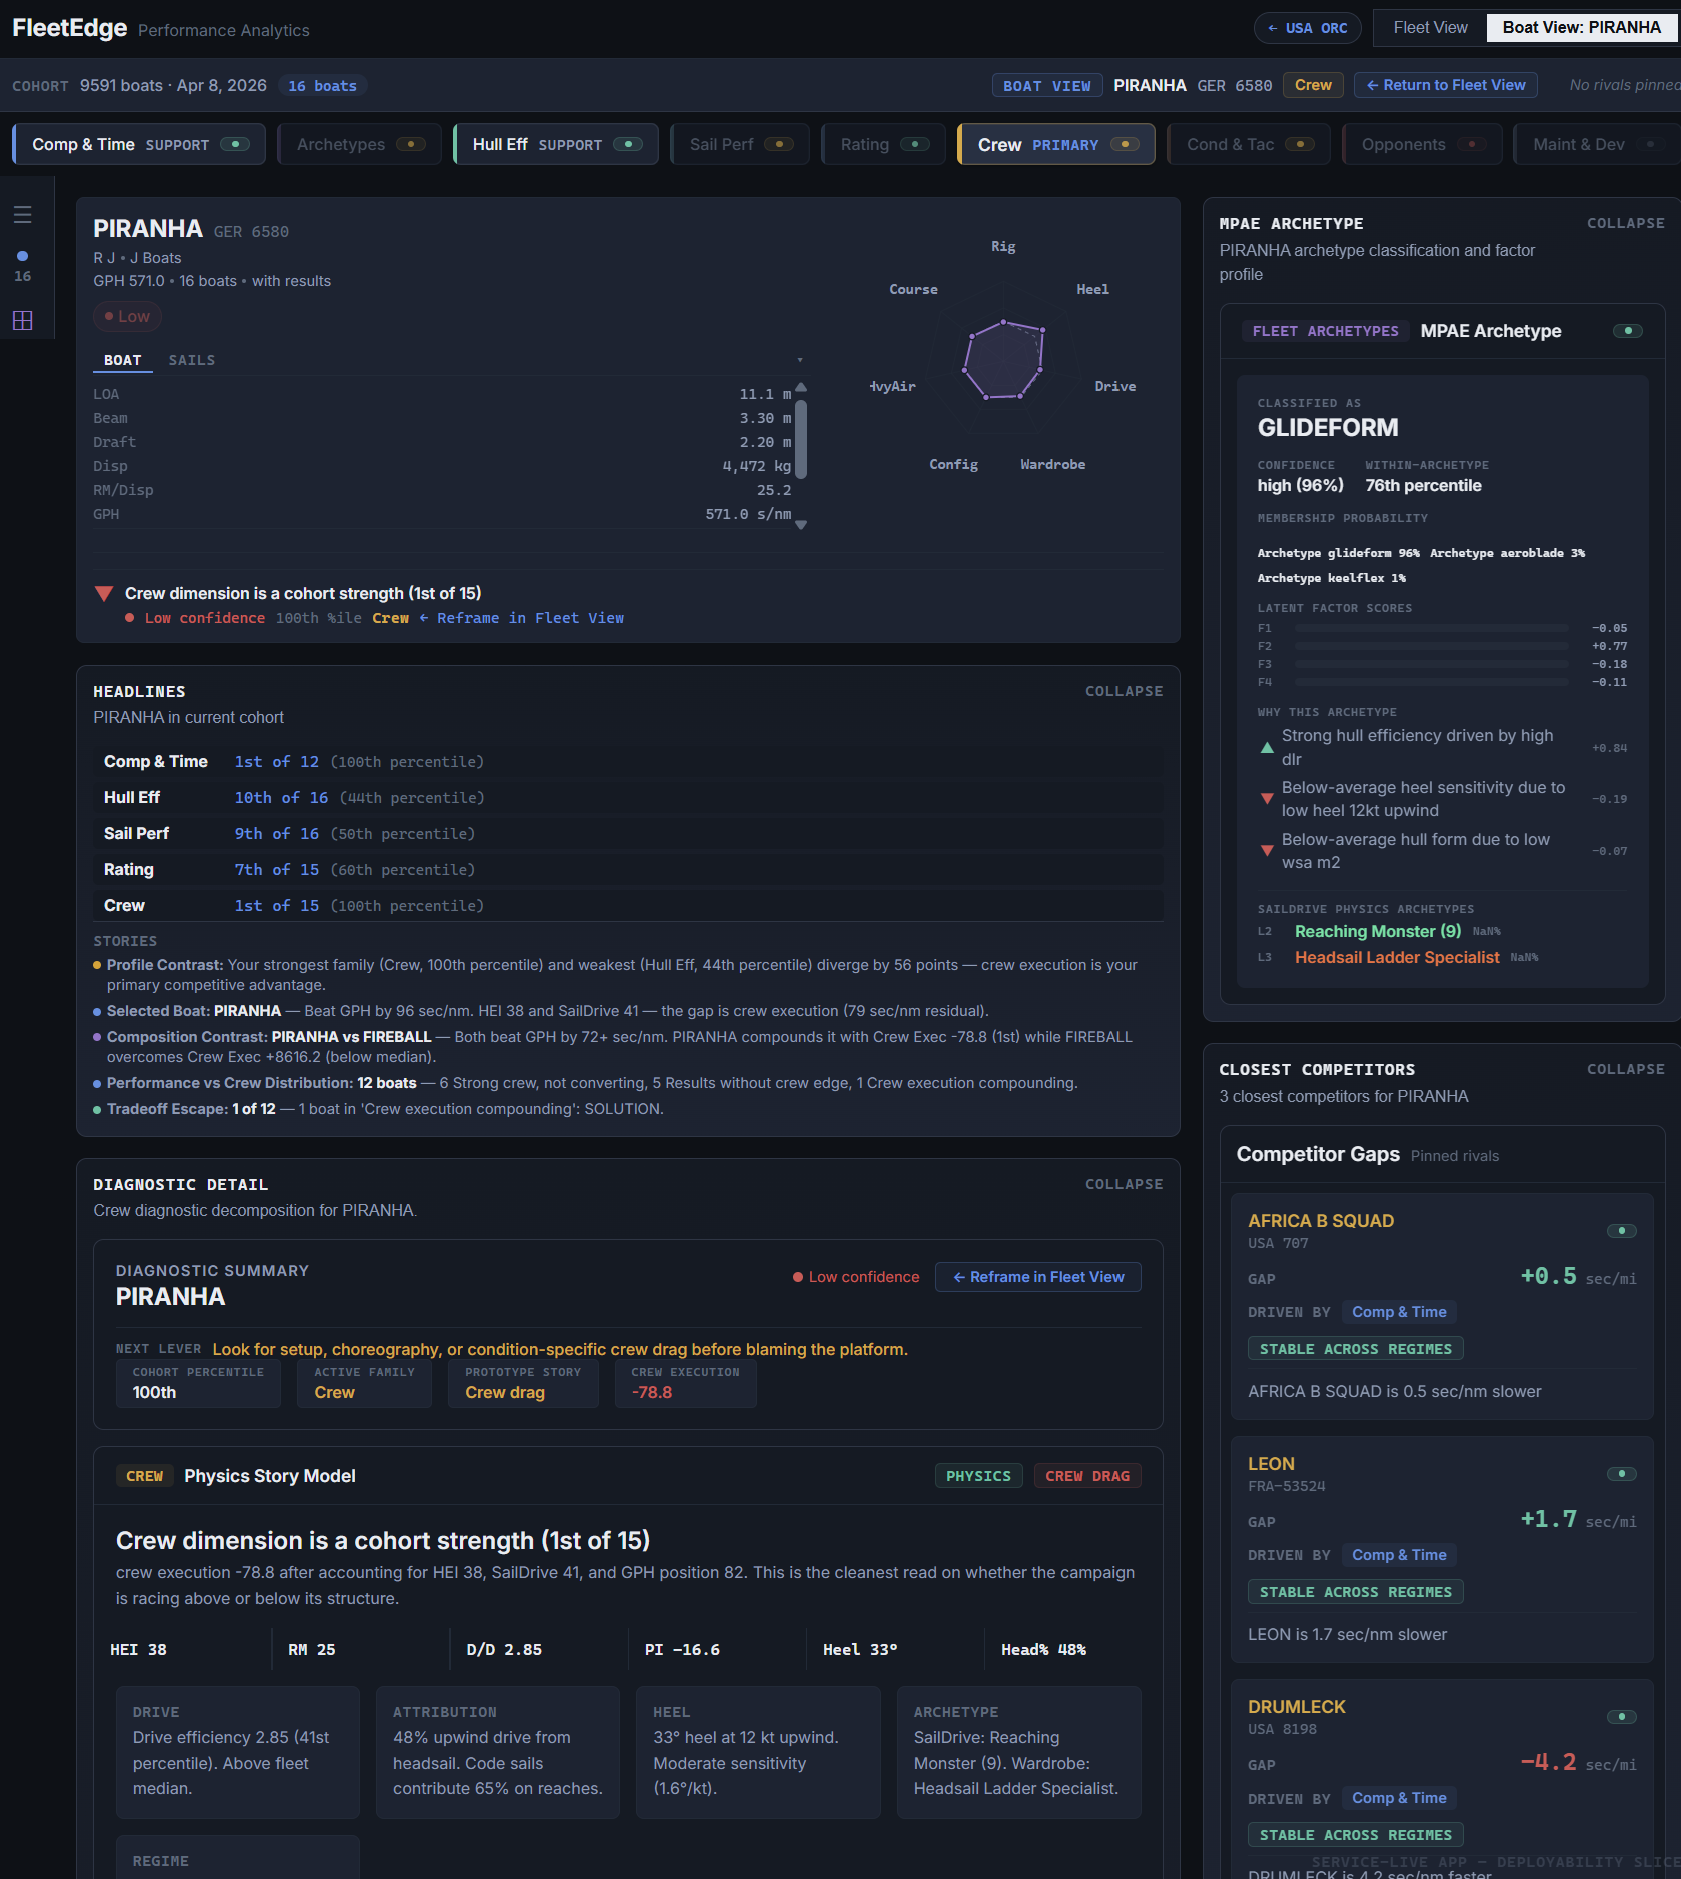
Because FleetEdge triangulates three independent authorities, every analytical output can be traced back to its data sources. The Performance Potential Index assigns each boat a score decomposed into physics potential, archetype condition fit, and crew execution — and every score includes a structured reason chain, a confidence tier, and a statement of what it does not measure.
Confidence tiers follow a weakest-link rule: a boat with strong physics data but limited race observations receives a low overall confidence, because the system is transparent about where it is certain and where it is not. Interpretation language enforces a neutral deadband — no directional claims in the middle of the distribution. The result is an analytical platform built for citation, not speculation. See the full explainability framework.
Five public evidence badges.
Every analytical card on FleetEdge carries a badge telling you what kind of claim it is. The lexicon is closed: five values, stable, auditable.
- Latest published view
- Live fleet-wide measurement. Results are stable enough for comparative use.
- Validation
- Methodology is under on-site validation. Results are directional while the validation run completes.
- Structural-only
- Dimensional or archetype analysis without race-result attribution. Describes what the fleet IS, not what it did.
- Low-sample
- Cohort is below the narrative floor for comparative analysis. The card ships a structural readout only; no comparative takeaways.
- Pre-race scenario
- Forward-looking analysis using forecast or historical-prior inputs. Not a measurement; a projection under stated conditions.
The data already exists. FleetEdge finds the structure.
Three authorities, fifty-two dimensions, eleven archetypes — applied to every boat in the ORC fleet.